Linux性能观测工具按类别可分为系统级别和进程级别,系统级别对整个系统的性能做统计,而进程级别则具体到进程,为每个进程维护统计信息。
按实现原理分,可分为基于计数器和跟踪以及剖析。含义如下:
计数器:内核维护的统计数据,通常为无符号整型,用于对发生的事件计数,比如,网络包接收计数器,磁盘IO计数器等。
跟踪:跟踪会收集每一个事件的具体数据,由于跟踪捕获事件数据需要消耗CPU且需要较大的存储空间储存收集数据,默认不开启。日志就是一种低频率的跟踪,会记录事件数据。
剖析:对目标采样或快照来归纳目标特征,如:CPU使用率,通过对程序计数器采样(一种寄存器,用于指示下一条指令的地址),跟踪栈找到消耗CPU周期的代码路径。剖析也可以通过非计时的硬件事件,如CPU硬件缓存未命中或总线活动,这类信息可以帮助开发人员针对系统资源的使用来优化自己的代码。
一 系统级计数器工具
系统级别的工具有vmstat、mpstat、iostat、netstat、sar,这些工具有使用惯例,可选时间间隔和次数。进程级别的工具使用内核为每个进程维护的计数器,有ps、top、pmap。本节主要讲基于计数器的系统级性能工具。
1.1 vmstat
vmstat是Virtual Meomory Statistics(虚拟内存统计),用来报告进程、内存、磁盘读写、CPU使用整体状况。常用形式vmstat delay count,其中delay表示采样间隔,count表示采样次数,命令执行结果如下图1.1所示,其中第一行表示系统启动以来各指标的平均值。

图1.1 vmstat命令
各个区域的含义如下:
- Procs
- r: The number of processes waiting for run time.运行态和就绪态进程数目
- b: The number of processes in uninterruptible sleep.不可中断进程数目,进程进行系统调用且被阻塞,不可中断和kill掉时的状态,绝大多数不可中断系统调用都比较快完成[1],比如mkdir(2)调用过程不会返回EINTR(调用过程被中断返回),不会被中断[2]。
- Memory
- swpd: the amount of virtual memory used.使用虚拟内存的大小
- free: the amount of idle memory.空闲内存的大小(物理内存)
- buff: the amount of memory used as buffers。Buff用于缓存磁盘块数据,如文件系统元数据,文件权限、位置等(metadata)
- cache: the amount of memory used as cache。Cache用于缓存文件内容[3]
- inact: the amount of inactive memory. (-a option)
- active: the amount of active memory. (-a option)
- Swap, 交换区,当内存不够时,内存中的页置换到磁盘中[4]
- si: Amount of memory swapped in from disk (/s).从磁盘交换到内存的大小
- so: Amount of memory swapped to disk (/s).从内存交换到磁盘的大小
- IO
- bi: Blocks received from a block device (blocks/s).每秒从块设备读出的块数(如从磁盘读文件会导致增加)
- bo: Blocks sent to a block device (blocks/s).每秒写入块设备的块数(如写数据到磁盘会导致增加)
- System
- in: The number of interrupts per second, including the clock.每秒中断次数(包括时钟中断)
- cs: The number of context switches per second.每秒上下文切换次数CPU
- us: Time spent running non-kernel code. (user time, including nice time),用户态代码时间,运行计算密集型进程(如压缩文件),会导致用户态CPU增加[3]。
- sy: Time spent running kernel code. (system time),内核态代码时间(如频繁运行系统调用/dev/urandom生成随机数,会导致sy增加)
- id: Time spent idle. Prior to Linux 2.5.41, this includes IO-wait time.空闲时间,包含了wa时间(cpu空闲的时候时间上会运行空闲线程)。
- wa: Time spent waiting for IO. Prior to Linux 2.5.41, included in idle.CPU空闲,但有由此CPU发起的IO在进行[4]
- st: Time stolen from a virtual machine. Prior to Linux 2.6.11, unknown.Steal time is the percentage of time a virtual CPU waits for a real CPU while the hypervisor is servicing another virtual processor.在云环境下,物理CPU由多台虚拟机共享,st表示本虚拟CPU等待分配真实CPU的时间,st过高表示可能有其他用户的虚拟机抢占CPU[5]。
vmstat中的统计值由内核交互文件/proc/meminfo(内存使用信息)、/proc/stat(系统整体进程状态,如运行态、不可中断阻塞态进程数,cpu使用情况)、/proc/*/stat(每个进程各自的状态信息)统计出。
/proc/meminfo文件内容如下,stat文件内容见1.2。

图1.2 meminfo文件内容
1.2 mpstat
mpstat是Multiprocessor Statistics的缩写,可以查看每个CPU核心的信息,而vmstat只能查看系统整体的CPU信息。
用法: mpstat [-P {|ALL}] [internal [count]],-P表示CPU列表,interval表示间隔,count表示采样次数。执行结果如下图1.3所示,各字段含义如下:

图1.3 mpstat结果图
- CPU:Processor number. The keyword all indicates that statistics are calculated as averages among all processors.具体的CPU,all值表示所有CPU的平均值统计信息。
- %usr:Show the percentage of CPU utilization that occurred while executing at the user level (application).
- %nice:Show the percentage of CPU utilization that occurred while executing at the user level with nice priority.nice值发生变动(即优先级发生变化)的进程的CPU时间,nice值为负表示进程的优先级变高。
- %sys:Show the percentage of CPU utilization that occurred while executing at the system level (kernel). Note that this does not include time spent servicing hardware and software interrupts.内核代码运行时间,不包括中断服务时间。
- %iowait:Show the percentage of time that the CPU or CPUs were idle during which the system had an outstanding disk I/O request.含义见1.1.1节vmstat的wa字段。
- %irq:Show the percentage of time spent by the CPU or CPUs to service hardware interrupts.CPU花在硬中断服务时间
- %soft:Show the percentage of time spent by the CPU or CPUs to service software interrupts. CPU花在软中断服务时间
- %steal:Show the percentage of time spent in involuntary wait by the virtual CPU or CPUs while the hypervisor was servicing another virtual processor.含义见1.1.1节vmstat的st字段
- %guest:Show the percentage of time spent by the CPU or CPUs to run a virtual processor.CPU运行虚拟处理器所花费的时间
- %gnice:Show the percentage of time spent by the CPU or CPUs to run a niced guest.
- %idle:Show the percentage of time that the CPU or CPUs were idle and the system did not have an outstanding disk I/O request.CPU空闲时间,和vmstat有点不同,这里不包含iowait时间,但vmstat包含。
vmstat数据来源/proc/stat,此文件包含所有cpu的活动,是开机累积到现在的统计值。文件内容如下图1.4所示,cpu表示总的信息,cpu0、cpu1…表示各cpu的信息,从前到后的值含义分别为user、nice、system、idle、iowait、irq、softirq、stealstolen、guest,以时间片为单位,intr后的第一个值表示系统自启动到现在的中断次数,后面的每一个值表示某种中断类型发生的次数,ctxt表示cpu上下文切换的次数,btime表示系统启动到现在的时间(实际观察前后两次未发生变化), processes表示系统启动到现在以来创建的任务个数, procs_running表示当前运行队列任务个数, procs_blocked表示阻塞任务个数,softirq表示总软中断次数及各种类型软中断的次数[6]。
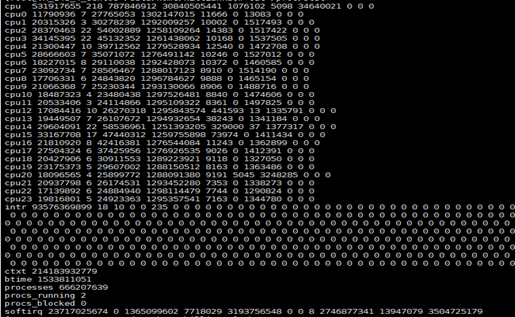
图1.4 /proc/stat文件内容
1.3 iostat
iostat是I/O statistics(输入/输出统计)的缩写,用来动态监视系统的磁盘操作活动。
用法: iostat [ -p [ device [,...] | ALL ] ] [ device [...] | ALL ] [ interval [ count ] ], -p表示设备列表,interval表示间隔,count表示采样次数。执行结果如下图1.5和1.6所示,其中选项-d表示显示设备统计(Display the device utilization report),-x表示显示详细信息(Display extended statistics)。各字段含义如下:
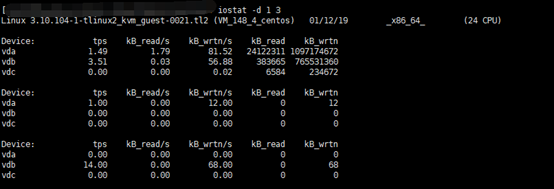
图1.5 iostat设备io统计信息

图1.6 iostat设备io详细统计信息
- Device:This column gives the device (or partition) name as listed in the /dev directory.设备名称
- Tps:Indicate the number of transfers per second that were issued to the device. A transfer is an I/O request to the device. Multiple logical requests can be combined into a single I/O request to the device. A transfer is of indeterminate size.每秒I/O次数(即每秒设备请求次数)
- Blk_read/s (kB_read/s, MB_read/s),Indicate the amount of data read from the device expressed in a number of blocks (kilobytes, megabytes) per second. Blocks are equivalent to sectors and therefore have a size of 512 bytes.每秒读数据多少
- Blk_wrtn/s (kB_wrtn/s, MB_wrtn/s),Indicate the amount of data written to the device expressed in a number of blocks (kilobytes, megabytes) per second.每秒写数据多少
- Blk_read (kB_read, MB_read),The total number of blocks (kilobytes, megabytes) read.interval间隔内读数据总量
- Blk_wrtn (kB_wrtn, MB_wrtn),The total number of blocks (kilobytes, megabytes) written. interval间隔内写数据总量
- rrqm/s,The number of read requests merged per second that were queued to the device.每秒合并读操作的数目,当两个读操作读相邻的数据块时,会被合并为一个请求,提高效率, 合并的操作通常是I/O scheduler(也叫elevator)负责的。(顺序读和随机读对比,顺序读此值会比较大)[7]
- wrqm/s,The number of write requests merged per second that were queued to the device. .每秒合并写操作的数目,当两个写操作写相邻的数据块时,会被合并为一个请求,提高效率(顺序写和随机写对比,顺序写此值会比较大)[7]
- r/s,The number (after merges) of read requests completed per second for the device.每秒读操作次数
- w/s,The number (after merges) of write requests completed per second for the device.每秒写操作次数
- rsec/s (rkB/s, rMB/s),The number of sectors (kilobytes, megabytes) read from the device per second.每秒读数据量大小,可以以sector和kB,MB为单位
- wsec/s (wkB/s, wMB/s),The number of sectors (kilobytes, megabytes) written to the device per second. 每秒写数据量大小,可以以sector和kB,MB为单位
- avgrq-sz,The average size (in sectors) of the requests that were issued to the device. 每个IO的平均扇区数,即所有请求的平均大小,以扇区(512字节)为单位
- avgqu-sz,The average queue length of the requests that were issued to the device.平均请求队列长度
- await,The average time (in milliseconds) for I/O requests issued to the device to be served. This includes the time spent by the requests in queue and the time spent servicing them.平均每个io的时间(包括了在等列中等待的时间和磁盘处理的时间)[8]。如果I/O模式很随机(磁盘服务时间)、I/O负载(队列中等待时间)比较高,会导致磁头乱跑,寻道时间长,那么相应地await要估算得大一些;如果I/O模式是顺序读写,只有单一进程产生I/O负载,那么寻道时间和旋转延迟都可以忽略不计,主要考虑传输时间,相应地await就应该很小,甚至不到1毫秒, 对磁盘阵列来说,因为有硬件缓存,写操作不等落盘就算完成,所以写操作的service time大大加快了,如果磁盘阵列的写操作不在一两个毫秒以内就算慢的了;读操作则未必,不在缓存中的数据仍然需要读取物理硬盘,单个小数据块的读取速度跟单盘差不多[9]。
- r_await,The average time (in milliseconds) for read requests issued to the device to be served. This includes the time spent by the requests in queue and the time spent servicing them. 平均每个读io的时间(包括了在等列中等待的时间和磁盘处理的时间)
- w_await,The average time (in milliseconds) for write requests issued to the device to be served. This includes the time spent by the requests in queue and the time spent servicing them. 平均每个写io的时间(包括了在等列中等待的时间和磁盘处理的时间)
- svctm,The average service time (in milliseconds) for I/O requests that were issued to the device. Warning! Do not trust this field any more. This field will be removed in a future sysstat version.(已被废弃)
- %util,Percentage of elapsed time during which I/O requests were issued to the device (bandwidth utilization for the device). Device saturation occurs when this value is close to 100%.工作时间或者繁忙时间占总时间的百分比,表示该设备有I/O(即非空闲)的时间比率,不考虑I/O有多少,只考虑有没有.现代硬盘都有并行处理的功能,当%util为100%时并不能说明磁盘处理已饱和,达到瓶颈,因为可能可以接收更多的并行处理请求,iostat没有衡量磁盘是否饱和的指标[9]。
iostat的统计数据主要来源与文件/proc/diskstats,文件内容如下图1.7所示:

图1.7 diskstats文件内容
每行各列的含义依序如下表1.1所示,各值为系统启动到现在为止的累加值:
表1.1 diskstats含义表
|
Field |
Value |
Quoted |
解释 |
|
F1 |
253 |
major number |
主设备号 |
|
F2 |
0 |
minor mumber |
从设备号 |
|
F3 |
vda |
device name |
设备名 |
|
F4(rd_ios) |
1012759 |
reads completed |
读完成次数 |
|
F5(rd_merges) |
3418 |
reads merged |
读合并次数 |
|
F6(rd_sectors) |
48466695 |
sectors read |
读取的扇区数 |
|
F7(rd_ticks) |
4027016 |
milliseconds spent reading |
所有读操作时间的累加值(ms单位) |
|
F8(wr_ios) |
19073830 |
writes completed |
写操作次数 |
|
F9(writes merged) |
33764041 |
writes merged |
写合并次数 |
|
F10(wr_sectors) |
2195716912 |
sectors written |
写入的扇区数 |
|
F11(wr_ticks) |
120769824 |
milliseconds spent writing |
所有写操作消耗的时间累加(ms单位) |
|
F12(in_flight) |
0 |
I/Os currently in progress |
未完成io的数目 |
|
F13(io_ticks) |
10982660 |
milliseconds spent doing I/Os |
该设备用于处理I/O的自然时间(wall-clock time) |
|
F14(time_in_queue) |
124778072 |
weighted # of milliseconds spent doing I/Os |
对字段F13(io_ticks)的加权值 |
in_flight表示系统未完成io的任务数,当io进入请求队列时加1(I/O请求进入队列时,而不是提交给硬盘设备时),当io任务完成时减1, in_flight包括在队列中等待和正在进行io的任务。
rd_ticks和wr_ticks是把每一个IO消耗时间累加起来,但是硬盘设备一般可以并行处理多个IO,因此,rd_ticks和wr_ticks之和一般会比自然时间(wall-clock time)要大。而io_ticks 不关心队列中有多少个IO在排队,它只关心设备有IO的时间。即不考虑IO有多少,只考虑IO有没有。在实际运算中,in_flight不是0的时候保持计时,而in_flight 等于0的时候,时间不累加到io_ticks。
其中,io_ticks这个字段被iostat用来计算%util,而time_in_queue这个字段被iostat用来计算avgqu-sz,即平均队列长度。[9]
1.4 netstat
netstat主要用来查看网络连接、路由表、网卡统计信息。
1.4.1 查看网络连接(等价ss)
用法:netstat [address_family_options] [--tcp|-t] [--udp|-u] [--udplite|-U] [--sctp|-S] [--raw|-w] [--listening|-l] [--all|-a] [--numeric|-n] [--numeric-hosts] [--numeric-ports] [--numeric-users] [--symbolic|-N] [--extend|-e[--extend|-e]] [--timers|-o] [--program|-p] [--verbose|-v] [--continuous|-c] [--wide|-W] [delay]
其中-t,-u等表示网络活动的协议,-l表示socket处于listening状态,-a表示显示所有状态(包括listening状态和非listening状态),-n表示主机、端口、用户用数字表示,不用解析成名称,-e表示详细信息,-p显示socket的进程pid和名称,-c会每秒连续输出网络信息。执行结果如下图1.8所示:

图1.8 netstat查看网络连接
部分字段含义如下:
- Recv-Q.
- Established: The count of bytes not copied by the user program connected to this socket. 指收到的数据还在缓存中,还没被进程读取,这个值就是还没被进程读取的 byte数。
- Listening: Since Kernel 2.6.18 this column contains the current syn backlog. syn backlog表示处于半连接状态的队列,接收到客户端的syn请求,则会进入此队列。
- Send-Q.
- Established: The count of bytes not acknowledged by the remote host. 发送队列中没有被远程主机确认的 bytes 数。
- Listening: Since Kernel 2.6.18 this column contains the maximum size of the syn backlog.半连接队列的最大大小
- State.The state of the socket. Since there are no states in raw mode and usually no states used in UDP and UDPLite, this column may be left blank. Normally this can be one of several values:
- ESTABLISHED.The socket has an established connection.三次握手,第三次握手发送ack后的状态
- SYN_SENT.The socket is actively attempting to establish a connection.发送syn后的状态
- SYN_RECV.A connection request has been received from the network.接收到syn+ack后的状态
- FIN_WAIT1.The socket is closed, and the connection is shutting down.socket被关闭,正在关闭连接(四次挥手,第一次挥手,主动发送FIN后的状态)
- FIN_WAIT2.Connection is closed, and the socket is waiting for a shutdown from the remote end.连接关闭,等待远端关闭信号(四次挥手,第二次挥手,接收到FIN的响应ACK后的状态)
- TIME_WAIT.The socket is waiting after close to handle packets still in the network. FIN_WAIT2状态接收到远端的FIN包,变为TIME_WAIT状态(四次挥手,收到第三次挥手FIN信号)
- CLOSE .The socket is not being used.
- CLOSE_WAIT.The remote end has shut down, waiting for the socket to close.对端已关闭,但本端向远端仍可以发送数据。(四次挥手,第二次挥手,向对端发送FIN信号的响应)
- LAST_ACK.The remote end has shut down, and the socket is closed. Waiting for acknowledgement. CLOSE_WAIT状态下,向远端发送FIN信号(四次挥手,第三次挥手,向对端发送FIN)
- LISTEN.The socket is listening for incoming connections. Such sockets are not included in the output unless you specify the --listening (-l) or --all (-a) option.
- CLOSING.Both sockets are shut down but we still don't have all our data sent.
- UNKNOWN.The state of the socket is unknown.
Recv-Q和Send-Q一般情况下为0值,可接收短暂情况情况下为非0情况,假如长时间为非0,表明队列有堆积,假如时Recv-Q为非0,应用程序接收不急,可能是拒绝服务攻击,假如是Send-Q为非0,可能是应用程序发送进程和服务端接收进程速度不匹配,发送太快或接收太慢[13]。
netstat的信息来源于/proc/net文件夹,关于tcp连接的信息来源于/proc/net/tcp文件,内容如下图1.9所示:
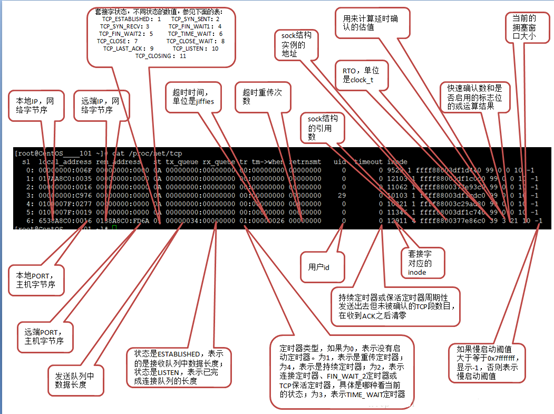
图1.9 /proc/net/tcp文件
1.4.2 查看路由表信息(等价ip route)
用法:netstat {--route|-r} [address_family_options] [--extend|-e[--extend|-e]] [--verbose|-v] [--numeric|-n] [--numeric-hosts] [--numeric-ports] [--numeric-users] [--continuous|-c] [delay]
执行结果如下图1.10所示,路由表信息来源于/proc/net/route文件:

图1.10 内核路由表
1.4.3 查看网卡统计信息(等价ip -s link)
用法:netstat {--interfaces|-I|-i} [--all|-a] [--extend|-e] [--verbose|-v] [--program|-p] [--numeric|-n] [--numeric-hosts] [--numeric-ports] [--numeric-users] [--continuous|-c] [delay]
执行结果如下图1.11:

图1.11 网卡活动统计
1.5 sar
sar(System Activity Reporter)用于统计和收集系统活动,包括CPU、内存、网络、IO等多方面,是一个比较全面的工具。sar收集系统数据保存在/var/log/sa/sadd(dd为日期)文件。
1.5.1 查看CPU使用情况
怀疑CPU存在瓶颈,可用 sar -u和 sar -q 等来查看。sar -u和mpstat相似,字段含义参考1.1.2。sar -p用于查看队列长度和负载信息,执行结果如下图1.12:

图1.12 sar -q执行结果
- runq-sz.Run queue length (number of tasks waiting for run time).运行态和就绪态任务数
- plist-sz.Number of tasks in the task list.处于任务队列的任务总数
- ldavg-1.System load average for the last minute. The load aver‐age is calculated as the average number of runnable or running tasks (R state), and the number of tasks in unin‐terruptible sleep (D state) over the specified interval.过去一分钟负载(处于运行态和就绪态及不可中断状态任务数)
- ldavg-5.System load average for the past 5 minutes.过去五分钟负载
- ldavg-15.System load average for the past 15 minutes.过去十五分钟负载
- Blocked.Number of tasks currently blocked, waiting for I/O to complete.等待io完成的处于阻塞态任务数。
1.5.2 查看内存使用情况
怀疑内存存在瓶颈,可用sar -B、sar -r 和 sar -W 等来查看,Sar -B,统计页交换情况。执行结果如图1.13:

图1.13 sar -B执行结果
- pgpgin/s,Total number of kilobytes the system paged in from disk per second.每秒从磁盘读入页的大小。
- pgpgout/s,Total number of kilobytes the system paged out to disk per second.每秒写入磁盘的页大小。
- fault/s,Number of page faults (major + minor) made by the system per second. This is not a count of page faults that generate I/O, because some page faults can be resolved without I/O.包括major和minor,major缺页需要进行磁盘io,但minor不需要,minor falut页在内存中,只是还未指定到进程地址空间,比如多进程代码共享,此时不需要重新从磁盘读入代码。
- majflt/s,Number of major faults the system has made per second,those which have required loading a memory page from disk. 每秒产生的要进行磁盘IO的缺页次数[16]
- pgfree/s,Number of pages placed on the free list by the system per second. 每秒放置在可用列表中的页数。
- pgscank/s,Number of pages scanned by the kswapd daemon per second. 表示的是Linux当中的负责内存回收的线程kswapd扫描的页的数量,
- pgscand/s,Number of pages scanned directly per second. 每秒直接扫描的页数
- pgsteal/s,Number of pages the system has reclaimed from cache (pagecache and swapcache) per second to satisfy its memory demands. 系统满足自身的内存需要,每秒从缓存回收的页数.
- %vmeff,Calculated as pgsteal / pgscan, this is a metric of the efficiency of page reclaim. If it is near 100% then almost every page coming off the tail of the inactive list is being reaped. If it gets too low (e.g. less than 30%) then the virtual memory is having some difficulty. This field is displayed as zero if no pages have been scanned during the interval of time. pgscan= pgscank/s+ pgscand/s,衡量分页回收有效性的指标,理想情况应该是100%或0(未发生页面扫描时), 表示被扫描的页当中, 有多少页的数据被踢出去了换成其他页数据了[17]
page fault和swap不同,当要访问的代码或数据没有虚拟地址和物理地址对应,会产生page fault;当内存空间不足,需要释放部分内存空间加载其它数据时,会将内存中的部分页swap到磁盘。[18]
sar -r统计内存使用情况。执行结果如下图1.14所示:

图1.14 sar -r执行结果
- kbcommit.Amount of memory in kilobytes needed for current workload. This is an estimate of how much RAM/swap is needed to guarantee that there never is out of memory.已经申请的内存的大小(可能未分配),对应/proc/meminfo中的Committed_AS
- %commit.Percentage of memory needed for current workload in relation to the total amount of memory (RAM+swap). This number may be greater than 100% because the kernel usually overcommits memory. Kbcommit和RAM+swap的百分比,可能大于100%,内核允许申请的内存大小大于总内存大小。[19]
- kbactive.Amount of active memory in kilobytes (memory that has been used more recently and usually not reclaimed unless absolutely necessary).活跃内存大小
- kbinact.Amount of inactive memory in kilobytes (memory which has been less recently used. It is more eligible to be reclaimed for other purposes).不活跃内存大小
- kbdirty.Amount of memory in kilobytes waiting to get written back to the disk. 等待写回硬盘的内存数量
sar -W统计swap in和out信息,执行结果如下图1.15所示:

图1.15 sar -W执行结果
- pswpin/s,Total number of swap pages the system brought in per second.每秒swap in数目
- pswpout/s,Total number of swap pages the system brought out per second.每秒swap out数目
1.5.3 查看设备IO情况
怀疑I/O存在瓶颈,可用 sar -b和 sar -d 等来查看,sar -b统计IO和传输速率信息,执行结果如下图1.16所示:

图1.16 sar -b执行结果
- tps.Total number of transfers per second that were issued to physical devices. A transfer is an I/O request to a physical device. Multiple logical requests can be combined into a single I/O request to the device. A transfer is of indeterminate size.每秒IO请求数
- rtps.Total number of read requests per second issued to physical devices.都请求数
- wtps.Total number of write requests per second issued to physical devices.写请求数
- bread/s.Total amount of data read from the devices in blocks per second. Blocks are equivalent to sectors with 2.4 kernels and newer and therefore have a size of 512 bytes. With older kernels, a block is of indeterminate size.每秒读取数据块个数
- bwrtn/s.Total amount of data written to devices in blocks per second.每秒写入磁盘的数据块数.
sar -d统计磁盘块活动,执行结果如下图1.17所示,和iostat字段含义类似。

图1.17 sar -d执行结果
1.5.4 查看网络流量情况
sar –n用于统计网络接收包信息,用法如下sar -n { keyword [,...] | ALL },关键有DEV, EDEV, FC, ICMP, EICMP, ICMP6, EICMP6, IP, EIP, IP6, EIP6, NFS, NFSD, SOCK, SOCK6, SOFT, TCP, ETCP, UDP and UDP6,分别从不同的角度展示网络统计信息,这里主要说明下DEV关键字,sar –n DEV执行结果如下图1.18所示:

图1.18 DEV结果
- IFACE.Name of the network interface for which statistics are reported.网络接口名
- rxpck/s.Total number of packets received per second.每秒收包数
- txpck/s.Total number of packets transmitted per second.每秒发包数
- rxkB/s.Total number of kilobytes received per second.每秒收到的kB数
- txkB/s.Total number of kilobytes transmitted per second.每秒发送的kB数
- rxcmp/s.Number of compressed packets received per second (for cslip etc.).每秒收到的压缩数据包
- txcmp/s. Number of compressed packets transmitted per second.每秒发送的压缩数据包
- rxmcst/s. Number of multicast packets received per second.每秒收到的广播数据包数
sar性能数据来源于/var/log/sa/saDD、/var/log/sa/saYYYYMMDD、以及/proc 和 /sys中的文件。
参考文献
[1]. Uninterruptible Sleep.https://eklitzke.org/uninterruptible-sleep
[2]. Checking if errno != EINTR: what does it mean?https://stackoverflow.com/questions/41474299/checking-if-errno-eintr-what-does-it-mean
[3]. Linux Performance Measurements using vmstat。https://www.thomas-krenn.com/en/wiki/Linux_Performance_Measurements_using_vmstat
[4]. Why CPU spent time on IO(wa)? https://serverfault.com/questions/684339/why-cpu-spent-time-on-iowa
[5]. Understanding CPU Steal Time - when should you be worried? http://blog.scoutapp.com/articles/2013/07/25/understanding-cpu-steal-time-when-should-you-be-worried
[6]. mpstat命令和/proc/stat文件. https://yq.aliyun.com/articles/53583/
[7]. Interpreting iostat Output. https://blog.serverfault.com/2010/07/06/777852755/
[8]. 容易被误读的IOSTAT. http://linuxperf.com/?p=156
[9]. 深入理解iostat. http://bean-li.github.io/dive-into-iostat/
[10]. 深入分析diskstats.http://ykrocku.github.io/blog/2014/04/11/diskstats/
[11]. I/O statistics fields. https://www.kernel.org/doc/Documentation/iostats.txt
[12]. 深入理解Linux TCP backlog. https://www.jianshu.com/p/7fde92785056
[13]. netstat Recv-Q和Send-Q. https://blog.csdn.net/sjin_1314/article/details/9853163
[14]. netstat用法及TCP state解析. https://www.cnblogs.com/vigarbuaa/archive/2012/03/07/2383064.html
[15]. /proc/net/tcp中各项参数说明. https://blog.csdn.net/justlinux2010/article/details/21028797
[16]. What does the fields in sar -B output mean? https://serverfault.com/questions/270283/what-does-the-fields-in-sar-b-output-mean
[17]. 如何控制Linux清理cache机制. https://www.zhihu.com/question/59053036/answer/171176545
[18]. Understanding page faults and memory swap-in/outs: when should you worry? http://blog.scoutapp.com/articles/2015/04/10/understanding-page-faults-and-memory-swap-in-outs-when-should-you-worry
[19].理解LINUX的MEMORY OVERCOMMIT. http://linuxperf.com/?p=102
 linux常用进程通信方式包括管道(pipe)、有名管道(FIFO)、...
 Linux性能观测工具按类别可分为系统级别和进程级别,系统级别...
 本文包含作者工作中常用到的一些命令,用于诊断网络、磁盘占满...
 linux的平均负载表示运行态和就绪态及不可中断状态(正在io)的...
 CPU上下文频繁切换会导致系统性能下降,切换分为进程切换、线...