当系统响应缓慢时,一般会用top或uptime命令查看系统负载是否过高。 例如输入uptime命令显示如下图,其中23:47:19表示现在的时间,up 260 days,14:39表示系统运行了多久,1 user表示当前登录用户数,最重要的是 load average,有三个数值,分别表示过去1分钟、5分钟、15分钟系统的负载。系统负载的英文解释为:
System load averages is the average number of processes that are either in a runnable or uninterruptable state. A process in a runnable state is either using the CPU or waiting to use the CPU. A
process in uninterruptable state is waiting for some I/O access, eg waiting for disk. The averages are taken over the three time intervals. Load averages are not normalized for the number of
CPUs in a system, so a load average of 1 means a single CPU system is loaded all the time while on a 4 CPU system it means it was idle 75% of the time.
系统负载表示每分钟处于可运行状态(运行态和就绪态)以及不可中断状态(等待io)的进程数目,且没有做归一化处理。

图1 uptime命令显示图
当平均负载等于CPU核数时是比较合理的状态,不会存在进程等待且也不会有CPU空闲浪费,查看CPU核数的命令如下:
grep 'model name' /proc/cpuinfo | wc -l
uptime命令过去1分钟,5分钟,15分钟的负载隐含了系统负载的变化趋势,假如这三个指标的值差不多,说明系统比较稳定,假如过去1分钟的负载比过去15分钟大很多,说明系统负载在增加,反之,则说明负载在减小。
平均负载和CPU使用率不是一个概念,平均负载高不能说明CPU使用率高,因为平均负载除了包括正在使用CPU的进程,还包括在等待CPU的进程和等待io的进程。
CPU使用率表示单位时间CPU的利用情况,CPU使用率和平均负载的关系有三个场景:
- CPU密集型进程,大量使用CPU会使CPU利用率和平均负载都增高。
- IO密集型进程,会使平均负载增高但CPU使用率不一定会增高。
- 大量等待CPU的进程调度会使平均负载增高,CPU使用率也会增高
可使用stress模拟这三种情况,stress为linux下的压测工具,并用mpstat和pidstat查看根源,mpstat显示CPU的使用情况,pidstat监视linux任务的统计信息,安装如下:
yum install stress sysstat
stress命令常用参数如下:
-c, --cpu N
spawn N workers spinning on sqrt()
-i, --io N
spawn N workers spinning on sync()
-t, --timeout N
timeout after N seconds
1.用stress模拟CPU密集型进程

用uptime查看负载

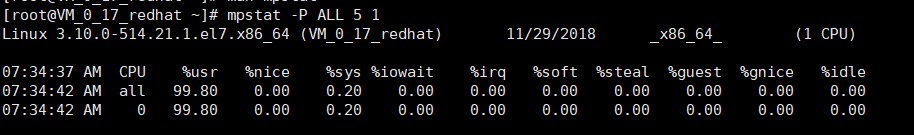
用mpstat查看CPU使用情况,如下,其中-P的含义为
-P { cpu [,...] | ON | ALL }
Indicate the processor number for which statistics are to be reported. cpu is the processor number. Note that processor 0 is the first processor. The ON keyword indicates that statistics
are to be reported for every online processor, whereas the ALL keyword indicates that statistics are to be reported for all processors.表示显示哪个处理器的使用情况. 5表示统计间隔为5s
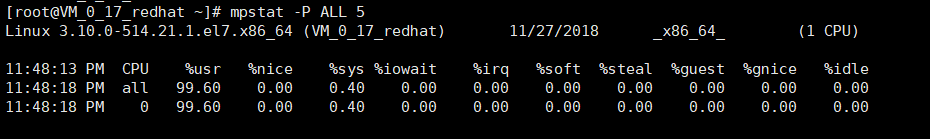
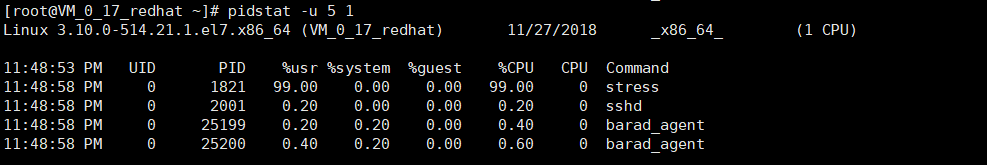
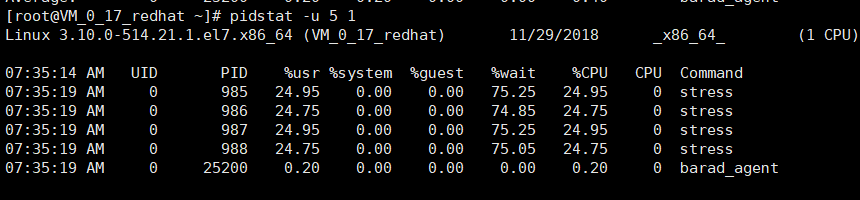
可以看到CPU使用率很高,pidstat查看具体占用CPU的进程,进程stress占的CPU达到99%,-u的含义为Report CPU utilization,5表示间隔5秒,1表示输出一组数据就停止,假如不加1,则会一直输出。
2.stress模拟io密集型进程

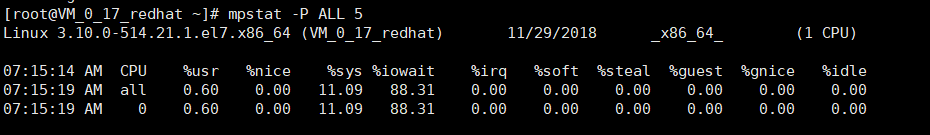
uptime查看负载,可以看到负载已经很高(单核CPU)

mpstat查看负载升高原因,可以看到CPU0的iowait高达88.31%,说明CPU有大量的时间在等待磁盘io,负载是由io进程导致,iowait含义:%iowait
Show the percentage of time that the CPU or CPUs were idle during which the system had an outstanding disk I/O request.
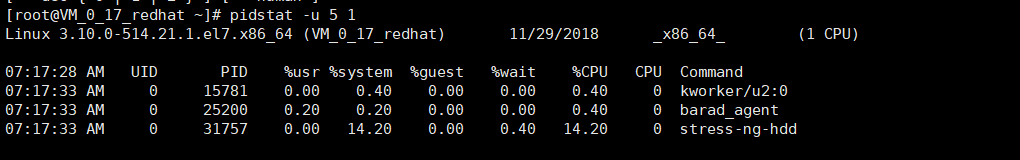
定位具体的进程,可以看到是stress-ng-hdd,wait含义
Percentage of CPU spent by the task while waiting to run.
3.stress模拟大量进程场景

uptime查看负载

mpstat可以看到CPU利用率已经很高
pidstat查看每个进程的CPU使用情况,四个stress进程均在有较高的百分比在等待CPU(%wait)
当uptime负载较高时,可能是CPU使用率较高,也可能是io进程较多,可以用mpstat查看CPU使用情况,并用pidstat查看定位具体进程
 linux常用进程通信方式包括管道(pipe)、有名管道(FIFO)、...
 Linux性能观测工具按类别可分为系统级别和进程级别,系统级别...
 本文包含作者工作中常用到的一些命令,用于诊断网络、磁盘占满...
 linux的平均负载表示运行态和就绪态及不可中断状态(正在io)的...
 CPU上下文频繁切换会导致系统性能下降,切换分为进程切换、线...