smoothie
smoothie 介绍
Smoothie Charts is a really small charting library designed for live streaming data. I built it to reduce the headaches I was getting from watching charts jerkily updating every second.
smoothie例子
html
<canvas id="chart" width="400" height="100"></canvas>
js
// Create a time series
var series = new TimeSeries();
// Find the canvas
var canvas = document.getElementById('chart');
// Create the chart
var chart = new SmoothieChart();
chart.addTimeSeries(series,{ strokeStyle: 'rgba(0,255,1)' });
chart.streamTo(canvas,500);
//Then,add data to your time series and it will be displayed on the chart:
// Randomly add a data point every 500ms
setInterval(function() {
series.append(Date.now(),Math.random() * 10000);
},500);
网站地址:http://smoothiecharts.org/
GitHub:https://github.com/joewalnes/smoothie
网站描述:是个极小的图表库,专为实时流媒体数据设计的
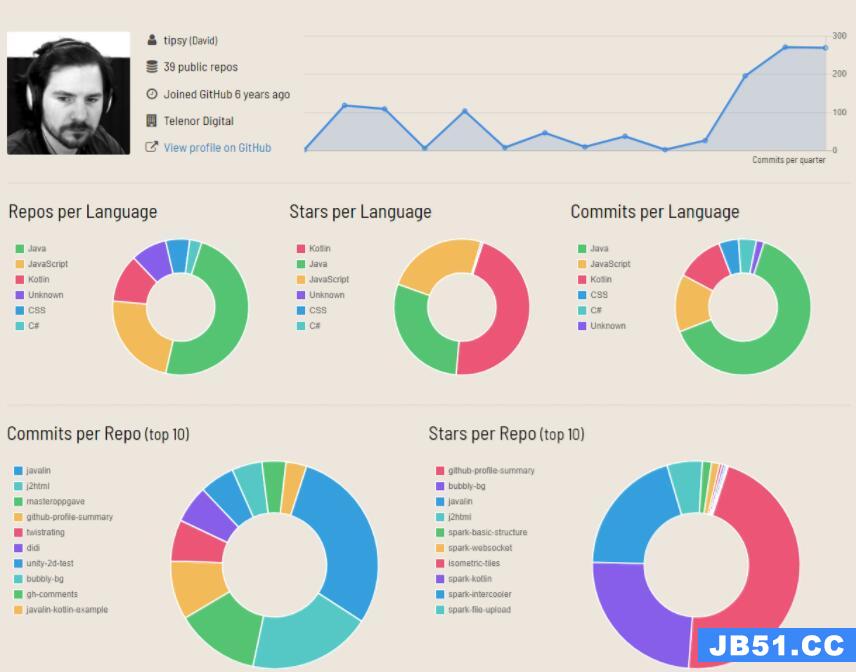 github-profile-summary,可视化GitHub概况的工具