-
安装包
以下安装包包含本人在安装中用到的大部分安装包,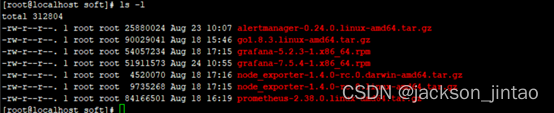
-
安装步骤
2.1 因为是国内环境下载这些安装包很慢有时候还会下一半卡住了,所以找朋友借了个梯子下载了安装包之后,用winscp直接扔到了服务器上。(安装前新建了个soft的文件夹:mkdir soft)
2.2 安装Promethues前先需要安装go的环境,
[root@localhost ~]# cd soft/
[root@localhost soft]# tar -C /usr/local -xzf go1.8.3.linux-amd64.tar.gz
2.3 修改配置文件
[root@localhost ~]# vi /etc/profile
进入后直接按大写G来到文件末尾添加如下内容
export PATH=$PATH:/usr/local/go/bin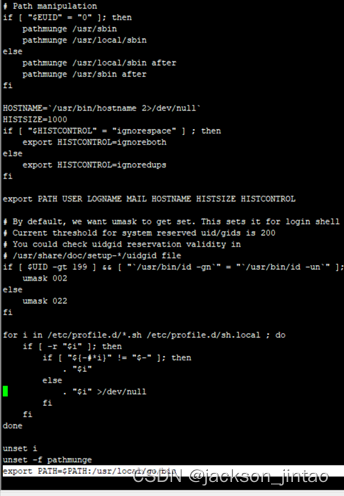
之后按esc,在:wq保存修改的内容
2.4 使配置文件生效
[root@localhost ~]# source /etc/profile
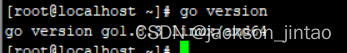
2.5 验证go语音环境安装是否成功
[root@localhost ~]# go version
2.6 安装Promethues
因为之前已经统一将需要用到的安装文件放置到服务器上,下面只需要在本地运行解压及安装程序
[root@localhost ~]# cd soft/
[root@localhost soft]# tar -vxf prometheus-2.38.0.linux-amd64.tar.gz -C /usr/local/
[root@localhost soft]# mv /usr/local/prometheus-2.38.0.linux-amd64 /usr/local/Promethues
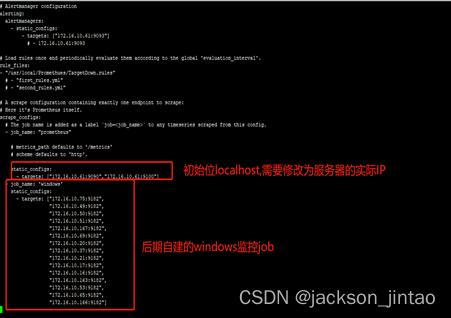
2.7 下面开始配置Promethues的监控配置文件
[root@localhost ~]# cd /usr/local/Promethues/
[root@localhost Promethues]# vi prometheus.yml
进入文件后按大写G
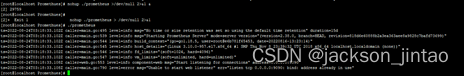
2.8 配置完成后运行软件
[root@localhost Promethues]# ./prometheus
可能需要先用到将软件后台运行
[root@localhost Promethues]# nohup ./prometheus >/dev/null 2>&1 &
[2] 29759
[root@localhost Promethues]#
[2]+ Exit 1 nohup ./prometheus > /dev/null 2>&1
[root@localhost Promethues]# ./prometheus
2.9 启动后可以通过如下URL打开prometheus的自带监控界面: IP:9090,点击targets 跳转到监控目标,这里展现了多个监控对象。红框的表示部署的prometheus
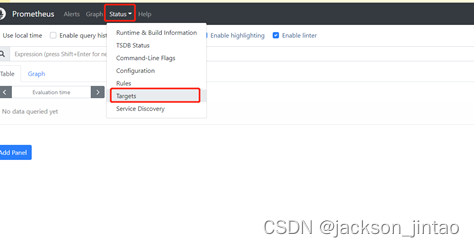
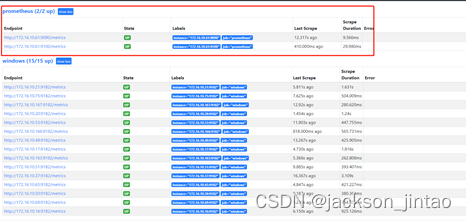
因为已经在Promethues的服务器上安装了node_exporter所以显示9100端口,如果是初始安装则只显示9090端口的信息(如果Promethues服务不需要监控则不需要在该服务器上安装node_exporter,那么就不会有9100的端口信息)
备注:相关学习借鉴:https://blog.csdn.net/csolo/article/details/82460539
以上是本人学习到的关于Promethues的基础安装,后面会发布关于grafana及alermanager的相关安装配置