目录
文件读取:
pandas可以简单的读取csv,excel,txt,如下:
import pandas as pd
#read csv
df_csv = pd.read_csv('1.csv')
#read excel
pd_excel = pd.read_excel('/Users/j.levis/PycharmProjects/爬豆瓣榜单/豆瓣榜单.xlsx')
#read txt
pd_txt = pd.read_table('2.txt')
读写的相关参数:
header=None 表示第一行不作为列名
index_col 表示把某一列或几列作为索引
usecols 表示读取列的集合
parse_dates 表示 需要转化为时间的列
nrows 表示读取的数据行数
以我之前爬取的豆瓣榜单为例:
pd_excel = pd.read_excel('/Users/j.levis/PycharmProjects/爬豆瓣榜单/豆瓣榜单.xlsx',usecols=['排名','书名'],nrows=5)


   排名    书名
0   1   红楼梦
1   2    活着
2   3  1984
3   4  百年孤独
4   5  三体全集
数据结构:
seriers:
Series 一般由四个部分组成,分别是序列的值 data 、索引 index 、存储类型 dtype 、序列的名字 name 。index默认为空.
object类型 代表了一种混合类型,正如上面的例子中存储了整数、字符串以及 Python 的字典数据结构。
s = pd.Series(data=[1,'你好',{'你好':'hello','再见':'bye'}],dtype='object',name = 'myname',index=['one','two','three'])

one                                 1
two                                你好
three    {'你好': 'hello', '再见': 'bye'}
Name: myname, dtype: object
s['one']
1dataframe:
DataFrame 在 Series 的基础上增加了列索引,一个数据框可以由二维的 data 与行列索引来构造
df = pd.DataFrame(
    data=[[1,2,3],[2,3,4],[4,5,6]]
)


   0  1  2
0  1  2  3
1  2  3  4
2  4  5  6
#index/列名默认012
设置列名:
df = pd.DataFrame(
    data={'col1':[1,2,3],'col2':['a','b','c'],'col3':['m','n','k']}
)

   col1 col2 col3
0     1    a    m
1     2    b    n
2     3    c    k
设置index:
df = pd.DataFrame(
    data={'col1':[1,2,3],'col2':['a','b','c'],'col3':['m','n','k']},
    index=['row1','row2','row3']
)


      col1 col2 col3
row1     1    a    m
row2     2    b    n
row3     3    c    k
可以直接写入excel:
df.to_excel('1.xlsx')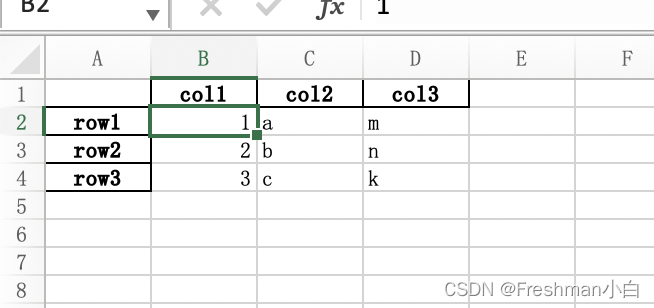
提取列:
在 DataFrame 中可以用 [col_name] 与 [col_list] 来取出相应的列与由多个列组成的表, 结果分别为 Series 和 DataFrame :
df['col2']


row1    a
row2    b
row3    c
Name: col2, dtype: object
df[['col1','col2']]
col1 col2
row1 1 a
row2 2 b
row3 3 c提取行
df.loc[['row1']]

      col1 col2 col3
row1     1    a    m
dataframe转置:
df.T

     row1 row2 row3
col1    1    2    3
col2    a    b    c
col3 m n k常用基本函数:
样例文件:learn_pandas.csv
df = pd.read_csv('learn_pandas.csv')
df = df[df.columns[:7]]#取前七列

    School      Grade            Name  Gender  Height  Weight Transfer
0        A   Freshman    Gaopeng Yang  Female   158.9    46.0        N
1        B   Freshman  Changqiang You    Male   166.5    70.0        N
2        A     Senior         Mei Sun    Male   188.9    89.0        N
3        C  Sophomore    Xiaojuan Sun  Female     NaN    41.0        N
4        C  Sophomore     Gaojuan You    Male   174.0    74.0        N
..     ...        ...             ...     ...     ...     ...      ...
195      C     Junior    Xiaojuan Sun  Female   153.9    46.0        N
196      D     Senior         Li Zhao  Female   160.9    50.0        N
197      A     Senior  Chengqiang Chu  Female   153.9    45.0        N
198      A     Senior   Chengmei Shen    Male   175.3    71.0        N
199      D  Sophomore     Chunpeng Lv    Male   155.7    51.0        N
汇总函数:
head(n)返回前n行
df.head(3)


School     Grade            Name  Gender  Height  Weight Transfer
0      A  Freshman    Gaopeng Yang  Female   158.9    46.0        N
1      B  Freshman  Changqiang You    Male   166.5    70.0        N
2 A Senior Mei Sun Male 188.9 89.0 Ntail(n)返回后n行
df.tail(3)


    School      Grade            Name  Gender  Height  Weight Transfer
197      A     Senior  Chengqiang Chu  Female   153.9    45.0        N
198      A     Senior   Chengmei Shen    Male   175.3    71.0        N
199      D  Sophomore     Chunpeng Lv    Male   155.7    51.0        N
info() 返回df的信息概况:
df.info()


<class 'pandas.core.frame.DataFrame'>
RangeIndex: 200 entries, 0 to 199
Data columns (total 7 columns):
 #   Column    Non-Null Count  Dtype
---  ------    --------------  -----
 0   School    200 non-null    object
 1   Grade     200 non-null    object
 2   Name      200 non-null    object
 3   Gender    200 non-null    object
 4   Height    183 non-null    float64
 5   Weight    189 non-null    float64
 6   Transfer  188 non-null    object
dtypes: float64(2), object(5)
memory usage: 11.1+ KB
describe() 返回df的数值列的统计信息:
df.describe()

           Height      Weight
count  183.000000  189.000000
mean   163.218033   55.015873
std      8.608879   12.824294
min    145.400000   34.000000
25%    157.150000   46.000000
50%    161.900000   51.000000
75%    167.500000   65.000000
max 193.900000 89.000000df_demo = df['Height']
df_demo.mean()
df_demo.quantile(0.75)
163.21803278688526
167.5count()返回非缺失值的个数:
df_demo.count()

183idmax()返回最大值的索引
df.idmax()

193唯一值函数:
对序列使用 unique 和 nunique 可以分别得到其唯一值组成的列表和唯一值的个数:
df['School'].unique()

['A' 'B' 'C' 'D']
df['School'].nunique()
4value_counts返回唯一值及其对应出现次数
df['School'].value_counts()

D    69
A    57
C    40
B 34排序函数:
sort_values值排序:
默认参数 ascending=True 为升序,false为降序
df_demo = df[['Height','Weight']]
print(df_demo.sort_values('Height').head(10)

     Height  Weight
143   145.4    34.0
49    147.3    34.0
120   147.8    34.0
30    148.7    41.0
80    150.5    40.0
139   150.5    36.0
185   151.2    43.0
89    151.5    44.0
29    151.6    43.0
39    151.7    38.0
在排序中,进场遇到多列排序的问题,比如在体重相同的情况下,对身高进行排序,并且保持身高降序排列, 体重升序排列:
df_demo.sort_values(['Weight','Height'],ascending=[True,False]).head()


Height  Weight
120   147.8    34.0
49    147.3    34.0
143   145.4    34.0
139   150.5    36.0
108   152.4    38.0