准备
安装v-charts依赖
npm i v-charts echarts -S
vue页面
可直接使用
<template>
  <div>
    <div style="display:flex;flex-direction:row;">
      <div class="title">{{ title }}</div>
    </div>
    <ve-line
      :extend="chartExtend"
      :height="height"
      :style="{'margin-top': title ? '' : '26px'}"
    />
  </div>
</template>

<script>
export default {
  props: {
    chartData: {
      type: Object,
      default: () => {}
    },
    height: {
      type: String,
      default: '300px'
    },
    chartExtends: {
      type: Object,
      default: () => {}
    },
    title: {
      type: String,
      default: ''
    },
    visualMap: {
      type: Object,
      default: () => {}
    },
    showTool: {
      type: Boolean,
      default: true
    }
  },
  data() {
    return {
      chartExtend: {
        series: [],
        legend: {
          data: this.chartData.title
        },
        grid: {
          left: 20,
          right: 20
        },
        toolBox: {
          show: this.showTool,
          feature: {
            magicType: {
              type: ['line', 'bar'],
              option: {
                line: {
                  type: 'line',
                  smooth: false
                }
              }
            },
            saveAsImage: {
              show: true,
              title: '保存'
            }
          }
        },
        visualMap: {
          orient: 'horizontal',
          left: '4%'
        },
        xAxis: {
          boundaryGap: false,
          type: 'category',
          data: this.chartData.row
        },
        yAxis: {
        }
      }
    }
  },
  watch: {
    chartData: {
      deep: true,
      immediate: true,
      handler(val) {
        console.log('chartData', val)
        const series = val.columns.map((item, index) => {
          return {
            type: 'line',
            data: item,
            name: val.title[index],
            color: val.color ? val.color[index] : '',
            smooth: false,
            animationDuration: 1000,
            animationEasing: 'quinticIn'
          }
        })
        this.chartExtend.series = series
      }
    },
    chartExtends(val) {
      this.chartExtend = { val, ...this.chartExtend }
    },
    visualMap: {
      immediate: true,
      deep: true,
      handler(val) {
        console.log(val)
        if (val) {
          this.chartExtend.visualMap = { ...this.chartExtend.visualMap, ...val, show: true }
          return
        }
        delete this.chartExtend.visualMap
      }
    }
  }
}
</script>

<style lang="scss" scoped>
    .title{
        width: 100%;
        font-size: 23px;
        font-weight: 600;
    }
</style>
组件api
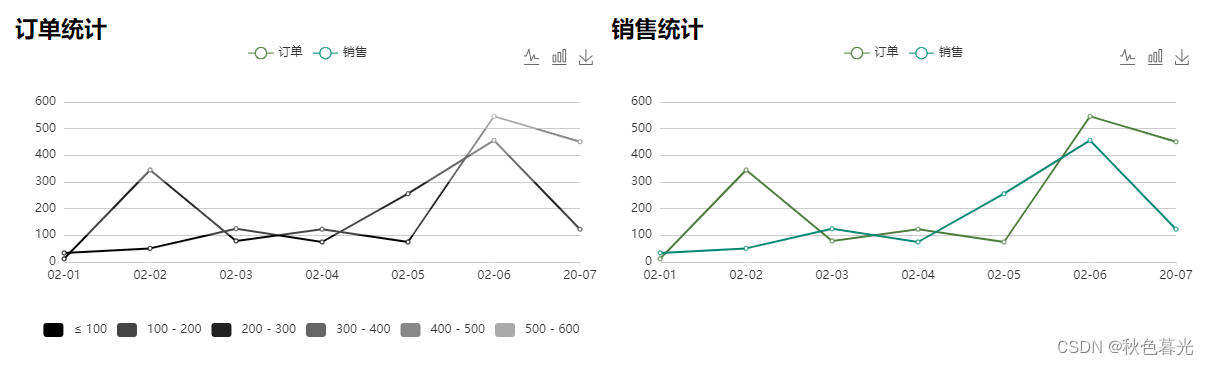
chartData: {
    title: ['订单', '销售'],
    color: ['#4e7b3f','#008771'],
    columns: [[12, 345, 79, 123, 75, 546, 451], [34, 51, 125, 75, 256, 456, 123]],
    row: ['02-01', '02-02', '02-03', '02-04', '02-05', '02-06', '20-07']
},
- height (String)
图表的高度,符合css样式规则 - chartExtends
图表设置
具体到 echarts api 根据需求配置 - title
图表的标题,也可以去 chartExtends 配置原生标题 - visualMap
配置 visualMap 属性,主要功能是设置不同阶段的颜色
具体到 echarts api 根据需求配置 - showTool
是否显示工具类,仅配置折线图,柱状图,保存为图片三个设置,如需更多或自定义工具,可以到 chartExtends 配置
具体配置方法到 echarts api 查询
注意
图表使用都是 canvas 进行绘图展示,需要一个独立的容器进行展示,有层级覆盖等问题,不推荐层级控制。如只需要展示数据,可以在组件外边套一个
<div style="position: relative;z-index: -1;">

</div>
使用例子
<div style="display: flex;flex-direction: row;justify-content: space-around;">
  <div style="width:49%;">
    <charts :chart-data="chartData" title="订单统计" :visual-map="visualMap" />
  </div>
  <div style="width:49%">
    <charts :chart-data="chartData" title="销售统计" :data-select="false" />
  </div>
</div>
data() {
    return {
      chartData: {
        title: ['订单', '销售'],
        color: ['#4e7b3f','#008771'],
        columns: [[12, 345, 79, 123, 75, 546, 451], [34, 51, 125, 75, 256, 456, 123]],
        row: ['02-01', '02-02', '02-03', '02-04', '02-05', '02-06', '20-07']
      },
      visualMap: {
        pieces: [
          { lte: 100, color: '#000' },	// gt大于  lte小于  color设置颜色
          { gt: 100, lte: 200, color: '#444' },
          { gt: 200, lte: 300, color: '#222' },
          { gt: 300, lte: 400, color: '#666' },
          { gt: 400, lte: 500, color: '#888' },
          { gt: 500, lte: 600, color: '#aaa' }
        ],
        outOfRange: {
          color: '#409EFF'	// 范围之外的颜色(默认颜色)会覆盖掉配置好的颜色
        }
      }
  },
效果图