痛点
1、添加主机重启?
2、添加主机vi yml文件
3、下载安装包缓慢
4、监控项英文-配置中文解释说明
5、指标项太多,没有中文解释说明
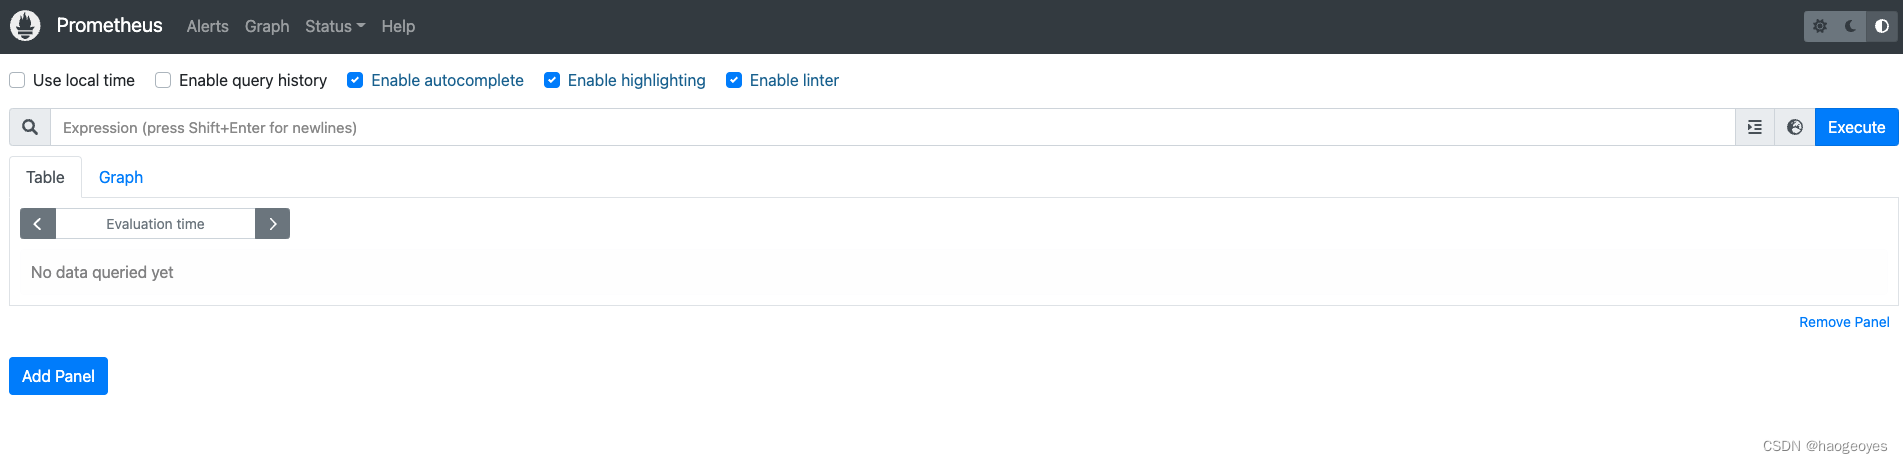
prometheus 监控部署
Prometheus 监控下载
https://prometheus.io/download/
服务端
https://github.com/prometheus/prometheus/releases/download/v2.38.0/prometheus-2.38.0.linux-amd64.tar.gz
监控端
https://github.com/prometheus/node_exporter/releases/download/v1.4.0-rc.0/node_exporter-1.4.0-rc.0.linux-amd64.tar.gz
服务端
tar zxvf prometheus-2.38.0.linux-amd64.tar.gz
mv /home/tianyan/tmp/cicd/monitor/prometheus-2.38.0.linux-amd64/ /usr/local/prometheus
启动
/usr/local/prometheus/prometheus  --config.file="/usr/local/prometheus/prometheus.yml" &
#lsof -i :9090
COMMAND    PID USER   FD   TYPE     DEVICE SIZE/OFF NODE NAME
prometheu 5867 root    3u  IPv4 1717204527      0t0  TCP localhost:35358->localhost:websm (ESTABLISHED)
prometheu 5867 root    7u  IPv6 1717201900      0t0  TCP *:websm (LISTEN)
prometheu 5867 root   11u  IPv6 1717205295      0t0  TCP localhost:websm->localhost:35358 (ESTABLISHED)
http://ip:9090
http://ip:9090/metrics
监控端
tar zxvf node_exporter-1.4.0-rc.0.linux-amd64.tar.gz
mv node_exporter-1.4.0-rc.0.linux-amd64/ /usr/local/node_exporter
nohup /usr/local/node_exporter/node_exporter &

监控配置
vi /usr/local/prometheus/prometheus.yml
 21 scrape_configs:
 22   # The job name is added as a label `job=<job_name>` to any timeseries scraped from this config.
 23   - job_name: "prometheus"
 24
 25     # metrics_path defaults to '/metrics'
 26     # scheme defaults to 'http'.
 27
 28     static_configs:
 29       - targets: ["localhost:9090"]
 30
 31   - job_name: "11.164.63.138_300G"
 32     static_configs:
 33       - targets: ["11.164.63.138:9100"]
 重启
 #lsof -i :9090
COMMAND    PID USER   FD   TYPE     DEVICE SIZE/OFF NODE NAME
prometheu 8696 root    3u  IPv4 1717288156      0t0  TCP localhost:35620->localhost:websm (ESTABLISHED)
prometheu 8696 root    7u  IPv6 1717287285      0t0  TCP localhost:websm->localhost:35620 (ESTABLISHED)
prometheu 8696 root    8u  IPv6 1717285523      0t0  TCP *:websm (LISTEN)
pkill prometheu
安装grafana
下载地址
https://grafana.com/grafana/download?platform=linux
下载
wget https://dl.grafana.com/enterprise/release/grafana-enterprise-9.1.1-1.x86_64.rpm
安装
rpm -vih grafana-enterprise-9.1.1-1.x86_64.rpm
warning: grafana-enterprise-9.1.1-1.x86_64.rpm: Header V4 RSA/SHA256 Signature, key ID 24098cb6: NOKEY
warning: Unable to get systemd shutdown inhibition lock: Unit is masked.
Preparing...                          ################################# [100%]
Updating / installing...
   1:grafana-enterprise-9.1.1-1       ################################# [100%]
### NOT starting on installation, please execute the following statements to configure grafana to start automatically using systemd
 sudo /bin/systemctl daemon-reload
 sudo /bin/systemctl enable grafana-server.service
### You can start grafana-server by executing
 sudo /bin/systemctl start grafana-server.service
POSTTRANS: Running script

启动
systemctl start grafana-server
lsof -i :3000
登录
http://ip:3000
admin
admin