前段时间需要做一个地图,由于思路错误等各种原因,走走停停也搞了大半个月。。。。。记录以下心路历程,希望能帮助到有需要的同学们。。。
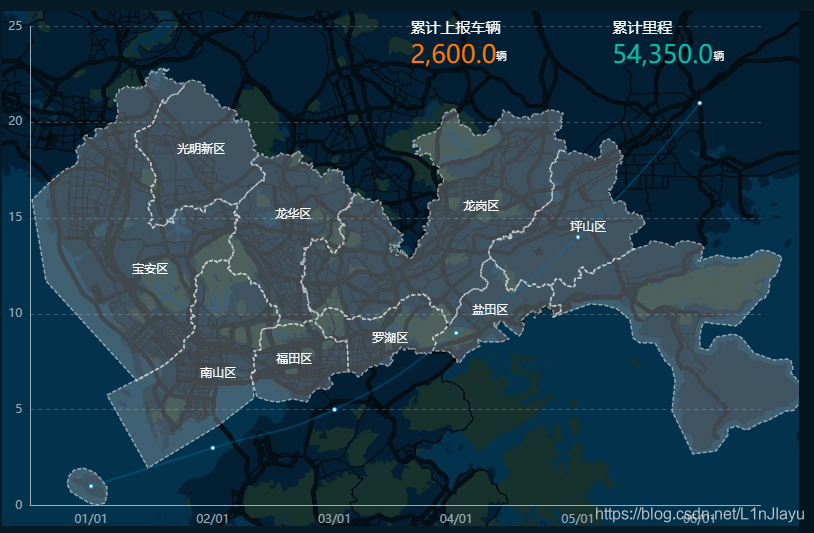
要求的效果大概是这个样子的:

第一反应就是,拿bmap作为底图,然后再用geo画一个地图,两个地图重合不就OK了嘛!结果。。太天真。。。查了很多资料,大概就是说,这样子做,会导致两个地图使用的是各自的地图组件,这样如果用户缩放的时候,就不会同步缩放,而且会有坐标点不在同一个地方的情况!
出现的效果大概是这个样子:

(上面的效果,是我用geo画的,拿到深圳地图的GeoJSON之后,注册到echarts,再画出来的)
可以很明显看到是不重合的,虽然经纬度是一样的,但是缩放的比例不一样,没有办法调整。。
(查文档的时候,看到有series-map可以使用geoIndex来让两个组件共享同一个地图组件,但是我用的是bmap,这个思路砍掉砍掉!)
然后就思考了一下,不如用series-custom??OMG,还要搞一堆坐标点,好像还要写好多个series-custom,太麻烦了,终归不是好的解决办法。。。
就这样走走停停,整个面板都块做完了,就剩地图了,不行,今天一定要搞出来!!!
换个思路,既然百度地图是echarts的扩展。。那么,何不直接使用百度地图提供的API?试试吧!
查了一下各自资料和文章,发现原来echarts使用了bmap以后,可以通过charts实例来获取里面使用到的地图组件。
let mapCharts= this.$echarts.init(document.getElementById('mapCharts'))
let map = mapCharts.getModel().getComponent('bmap').getBMap();这样,就拿到这个地图组件了,可以随意使用百度地图提供的API了!
官方有提供画行政区域的的例子:地图JS API示例 | 百度地图开放平台
主要是使用Boundary()画边界、Label()画标签。
(我只拿了比较关键的代码过来,完整的还是去官方例子看比较清楚)
var bdary = new BMap.Boundary()
bdary.get("北京市海淀区", function(rs){       //获取行政区域
    var count = rs.boundaries.length; //行政区域的点有多少个
    var pointArray = [];
    for (var i = 0; i < count; i++) {
        var ply = new BMap.polygon(rs.boundaries[i], {strokeWeight: 2, strokeColor: "#ff0000"}); //建立多边形覆盖物
        map.addOverlay(ply);  //添加覆盖物
        pointArray = pointArray.concat(ply.getPath());
    }
}效果:

参考了以后,终于解决了问题!
这是后面做出来的:
项目使用的是Vue,需要引入:
// main.js中 引入
import echarts from "echarts"
Vue.prototype.$echarts = echarts
// 当前模块引入
import 'echarts/extension/bmap/bmap'
option:
mapChartsOpt: {
    title: [
        {
            text: '累计上报车辆',
            top: '1%',
            left: '50%',
            textStyle: {
                color: '#fff',
                fontWeight: 'normal',
                fontSize: 15
            }
        },
        {
            text: `{number|2,600.0    } 辆`,
            top: '6%',
            left: '50%',
            textStyle: {
                color: '#fff',
                fontWeight: 'normal',
                fontSize: 10,
                rich: {
                    number: {
                        color: '#FF7800',
                        fontWeight: 'normal',
                        fontSize: '180%'
                    }
                }
            },

        },
        {
            text: '累计里程',
            top: '1%',
            left: '75%',
            textStyle: {
                color: '#fff',
                fontWeight: 'normal',
                fontSize: 15
            }
        },
        {
            text: `{number|54,350.0     } 辆 `,
            top: '6%',
            left: '75%',
            textStyle: {
                color: '#fff',
                fontWeight: 'normal',
                fontSize: 10,
                rich: {
                    number: {
                        color: '#05BDAB',
                        fontWeight: 'normal',
                        fontSize: '180%'
                    }
                }
            },

        }
    ],
    bmap: {
        center: [114.173632,22.648713],
        zoom: 11,
        roam: true,
        mapStyle: {
            styleJson: [
                {
                    "featureType": "water",
                    "elementType": "all",
                    "stylers": {
                        "color": "#03324C"
                    }
                },
                {
                    "featureType": "land",
                    "elementType": "all",
                    "stylers": {
                        "color": "#031F33"
                    }
                },
                {
                    "featureType": "boundary",
                    "elementType": "geometry",
                    "stylers": {
                        "color": "#3C4952"
                    }
                },
                {
                    "featureType": "railway",
                    "elementType": "all",
                    "stylers": {
                        "visibility": "off",
                        "color": "#030C12"
                    }
                },
                {
                    "featureType": "highway",
                    "elementType": "geometry",
                    "stylers": {
                        "color": "#030C12"
                    }
                },
                {
                    "featureType": "highway",
                    "elementType": "geometry.fill",
                    "stylers": {
                        "color": "#030C12",
                        "lightness": 1
                    }
                },
                {
                    "featureType": "highway",
                    "elementType": "labels",
                    "stylers": {
                        "visibility": "off",
                        "color": "#030C12"
                    }
                },
                {
                    "featureType": "arterial",
                    "elementType": "geometry",
                    "stylers": {
                        "color": "#030C12",
                    }
                },
                {
                    "featureType": "arterial",
                    "elementType": "geometry.fill",
                    "stylers": {
                        "color": "#030C12"
                    }
                },
                {
                    "featureType": "poi",
                    "elementType": "all",
                    "stylers": {
                        "visibility": "off",
                        "color": "#030C12"
                    }
                },
                {
                    "featureType": "green",
                    "elementType": "all",
                    "stylers": {
                        "color": "#17312C",
                        "visibility": "on"
                    }
                },
                {
                    "featureType": "local",
                    "elementType": "all",
                    "stylers": {
                        "visibility": "off",
                        "color": "#030C12"
                    }
                },
                {
                    "featureType": "arterial",
                    "elementType": "labels",
                    "stylers": {
                        "visibility": "off",
                        "color": "#030C12"
                    }
                },
                {
                    "featureType": "building",
                    "elementType": "all",
                    "stylers": {
                        "color": "#1a5787"
                    }
                },
                {
                    "featureType": "label",
                    "elementType": "all",
                    "stylers": {
                        "visibility": "off",
                        "color": "#030C12"
                    }
                },
                {
                    "featureType": "subway",
                    "elementType": "all",
                    "stylers": {
                        "visibility": "off"
                    }
                }
            ]
        }
    },
    grid: {
        left: '3.5%',
        top: '3%',
        bottom: '4%',
        right: '6%'
    },
    xAxis: {
        type: 'category',
        data: ['01/01', '02/01', '03/01', '04/01', '05/01', '06/01'],
        axisLabel: {
            color: '#9AACB4'
        },
        axisLine: {
            linestyle: {
                color: '#9AACB4'
            }
        },
        axisTick: {
            show: false
        }
    },
    yAxis: {
        type: 'value',
        axisLabel: {
            color: '#9AACB4'
        },
        axisLine: {
            linestyle: {
                color: '#9AACB4'
            }
        },
        axisTick: {
            show: false
        },
        splitLine: {
            show: true,
            linestyle: {
                type: 'dashed',
                opacity: 0.3
            }
        }
    },
    series: [
        {
            type: 'line',
            smooth: true,
            linestyle: {
                color: '#007EB1',
                opacity: 0.3
            },
            itemStyle: {
                normal: {
                    color: '#007EB1'
                },
                opacity: 0.3
            },
            data: [
                {
                    name: '01/01',
                    value: 1
                },
                {
                    name: '02/01',
                    value: 3
                },
                {
                    name: '03/01',
                    value: 5
                },
                {
                    name: '04/01',
                    value: 9
                },
                {
                    name: '05/01',
                    value: 14
                },
                {
                    name: '06/01',
                    value: 21
                }
            ]

        }
    ]
}
initCharts:
initCharts() {
    // 项目使用的是Vue,所以这里用了this
    let mapCharts = this.$echarts.init(document.getElementById('mapCharts '))
    mapCharts .setoption(this.mapChartsOpt)

    // ========================== 以下是遮罩层绘制 ==========================
    var map = mapCharts .getModel().getComponent('bmap').getBMap();
    let districtList = ['深圳市罗湖区','深圳市南山区','深圳市福田区','深圳市盐田区','深圳市宝安区','深圳市龙岗区','深圳市龙华区','光明区','坪山区']
    let bdary = new BMap.Boundary();    // 边界
    // 覆盖物绘制
    districtList.forEach(item => {
        bdary.get(item, (rs) => {               //获取行政区域
            let count = rs.boundaries.length;   //行政区域的点有多少个
            if (count === 0) {
                alert('未能获取当前输入行政区域');
                return ;
            }
            let pointArray = [];
            for (let i = 0; i < count; i++) {
                let ply = new BMap.polygon(rs.boundaries[i], {  //建立多边形覆盖物
                    strokeWeight: 1.5,
                    strokeColor: "#ffffff",
                    strokeStyle: 'dashed',
                    strokeOpacity:0.5,
                    fillColor: '#cccccc',
                    fillOpacity: 0.3
                });
                map.addOverlay(ply);  //添加覆盖物
                pointArray = pointArray.concat(ply.getPath());
            }
        });
    })
    // 标签绘制
    let labelPoints = [ new BMap.Point(114.133407,22.586888), new BMap.Point(113.935636,22.549798), new BMap.Point(114.024068,22.564752),
                        new BMap.Point(114.249191,22.617713), new BMap.Point(113.858371,22.660982), new BMap.Point(114.238041,22.7282),
                        new BMap.Point(114.022692,22.720197), new BMap.Point(113.909312,22.789131), new BMap.Point(114.361997,22.705532)]
    let optsArray = [{},{},{},{},{},{},{},{},{}]
    let labelArray = []
    let contentArray = ["罗湖区", "南山区", "福田区", "盐田区", "宝安区", "龙岗区", "龙华区", "光明新区", "坪山区"]
    for(let i = 0;i < labelPoints.length; i++) {
        optsArray[i].position = labelPoints[i]
        labelArray[i] = new BMap.Label(contentArray[i],optsArray[i])
        labelArray[i].setStyle({
            color : "white",
            fontSize : "12px",
                height : "20px",
                lineHeight : "20px",
                fontFamily:"微软雅黑",
                borderWidth: 0,
                backgroundColor: 'transparent'
            });
        map.addOverlay(labelArray[i])
    }
}【补充】下面是我参考的,觉得有帮助的各种资料、文章和工具
百度地图官方API地址:百度地图JSAPI 2.0类参考
百度地图-行政划区示例:地图JS API示例 | 百度地图开放平台
阿里官方提供的在线获取GeoJSON、SVG:DataV.GeoAtlas地理小工具系列
【Echarts-百度地图省分着色】Echarts-百度地图省分着色 - SegmentFault 思否
【Echartsgallery实例】https://gallery.echartsjs.com/editor.html?c=xr1IEt3r4Q