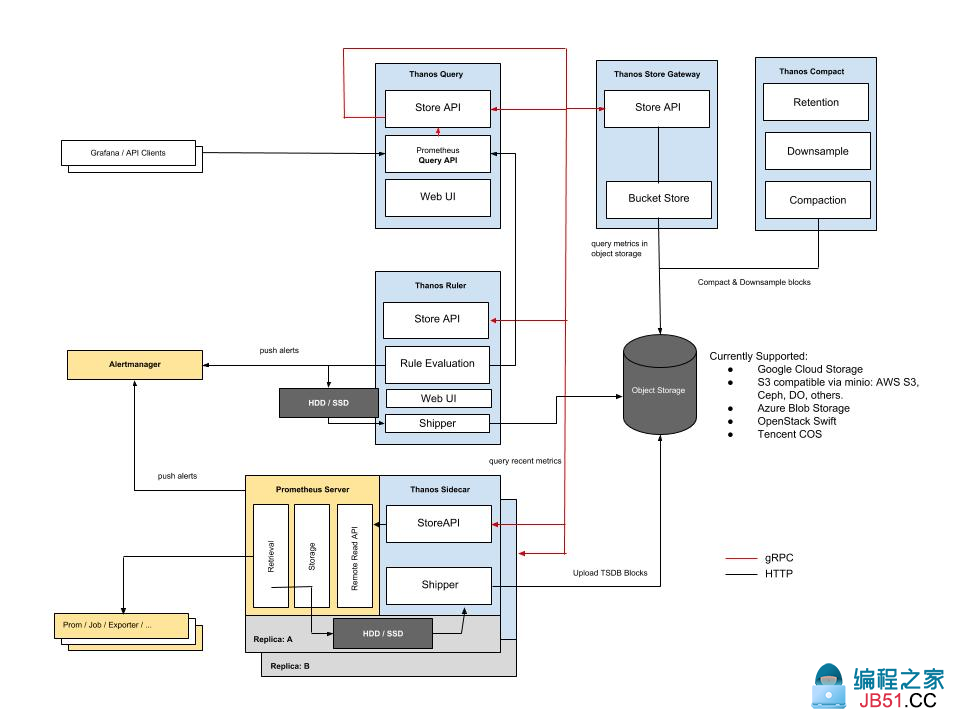
关于thanos的介绍可以参考这篇官方博客的翻译文档,本文不作部署操作介绍。下图是thanos的官方架构图,主要有5个组件:
- Query:可以近似看作是Prometheus的实现,用于采集其他组件的数据,如sidecar和store gateway。Query的UI与Prometheus基本相同。
- Store Gateway:用于获取来自对象存储的历史数据,它使得Query可以获取历史数据,并通过Grafana展示。
- Compact:用于历史数据的压缩和降准采样,提高在Grafana上执行Zoom-in/Zoom-out时的效率。
- Ruler:配置告警相关的内容,Ruler的UI与Alertmanager原生的UI基本相同。
- Sidecar:与Prometheus部署,一来为Query提供未持久化到对象存储的数据;二来将超期的数据持久化到对象存储。
通常thanos管理多集群时,除Sidecar组件需要在每个集群内部署,其余组件仅部署一份,用于处理多个集群的数据。需要注意的是,thanos的StoreAPI采用的是gRPC协议,只能走四层通信,像在openshift 3.11版本下无法通过router(ingress)暴露给集群外部的Query等组件。规避办法为采用nodePort方式暴露,但通常nodePort并不是一个很好的方式,因为它占用了主机的端口。
从使用上看,thanos使用上最主要的作用就是实现了数据的持久化以及历史数据的提取,其实现的StoreAPI也可以作为可移植的功能。
TIPS:
type: ALIYUNOSS
config:
  endpoint: ""
  bucket:
  access_key_id:
  access_key_secret: ""
- 可以在源码中使用make build编译源码
- 可以使用下述校验对象存储状态,如thanos bucket ls --objstore.config-file=/etc/thanos/oss.yml 列出所有的bucket信息
  bucket verify [<flags>]
    Verify all blocks in the bucket against specified issues

  bucket ls [<flags>]
    List all blocks  the bucket

  bucket inspect [<flags>]
    Inspect all blocks in the bucket in detailed,table-like way
- Query,Ruler,Store_Gateway和Compact的docker-compose启动方式可以参考如下yaml文件
version: '3.1'

volumes:
    grafana_data: {}
    minio_data: {}
    store_data: {}
    compactor_data: {}

services:
  thanos-querier:
    image: ${thanos-image}
    extra_hosts:
      - "{$bucket_name}.${oss_backend}:${oss_backend_ip}}" #ali-yun需要添加这一行解析
      - "${oss_backend}:${oss_backend_ip}}"
    command:
      - query'
      - --grpc-address=0.0.0.0:10901   # Query storeAPI
      - --http-address=0.0.0.0:10902   # Query UI
      - --query.replica-label=replica--store=${prometheus_sidecar_lb}:${prometheus_sidecar_lb_port}--store=thanos-store-gateway:10901
    privileged: true
    ports:
      - 10902:10902
    restart: always

  thanos-store-gateway:
    image: ${thanos-image}
    extra_hosts:
      - "{$bucket_name}.${oss_backend}:${oss_backend_ip}}"
      -
    volumes:
      - ./thanos/:/etc/thanos/
      - store_data:/data
    command:
      - store--data-dir=/data--objstore.config-file=/etc/thanos/bucket_config.yaml # Object store config file
    privileged:
    restart: always

  thanos-compactor:
    image: ${thanos-
    volumes:
      - ./thanos/:/etc/thanos/
      - compactor_data:/compact--log.level=debug--wait
    restart: always

  grafana:
    image: ${grafana-image}
    user: 1043000:3000
    volumes:
      - grafana_data:/var/lib/grafana
    restart: always

  thanos-ruler:
    image: ${thanos-image}
    volumes:
      - ./thanos/:/etc/thanos/rule  # Ruler Store API
      -   # Ruler UI
      - --eval-interval=15s--query=thanos-querier:10902--alertmanagers.url=http://alertmanager:9093--rule-file=/etc/thanos/*.rules.yaml--label=monitor_cluster=\"poc-ocp01\""
      - --label=replica=\"r1\"10903:
    depends_on:
      - thanos-querier
    restart: always

  alertmanager:
    image: ${alertmanager-image}
    ports:
      - 10904:9093
    volumes:
      - ./thanos/:/etc/alertmanager/
    restart: always
    privileged: --data.retention=120h--web.listen-address=0.0.0.0:9093--config.file=/etc/alertmanager/alertmanager.yaml--storage.path=/alertmanager'
TIPS:
- 创建alertmanager高可用集群可以参见这里
- prometheus和ruler都需要配置external label,否则可能会出现数据冲突
- store-gateway可能会发生OOM,可以尝试使用--max-time命令限制查找的metric的范围。参见该issue
- compactor建议配置--consistencyDelay参数,防止由于畸形报文导致compactor崩溃
 文章浏览阅读3.8k次。上篇文章详细介绍了弹性云混部的落地历...
 文章浏览阅读897次。对于cpu来说,这种分配方式并不会有太大...
 文章浏览阅读763次。但是此时如果配置成 NONE, 租户创建成功...