问题描述
我经历了对我来说很奇怪的行为。当我调整浏览器窗口的大小时,然后卸载该组件,并再次渲染我的来宾,但是松散了所有预期状态
对于main.js,我编写了一个称为自身的递归函数:
import React from "react";
import { render } from "react-dom";

// TTL element
import TTLChart from "./TTLChart"
import TTLChartControl from "./TTLChartControl"
import TTLChartEditControl from "./TTLChartEditControl"

(function(window){

console.log('TTLStockChartInit');
window.TTLStockChart = TTLStockChart;

function TTLStockChart(pChartElement,pChartCtrlElement,pChartEditCtrlElement)
{
    if (!pChartCtrlElement)
    {
        //🤷
        render(
            <div id="chartWithLoader">
                <div id="TTLStockChart_Loaderdiv" className="TTLStockChart_Loaderdiv" style={{"display":"none"}}></div>
                <div id="TTLStockChart_NoData" className="TTLStockChart_NoData" style={{"display":"none"}}>No Data</div>
                <div id="TTLStockChart_C_Main" className="TTLStockChart_C_Main"/>
                <div id="TTLStockChart_C_Ctl" className="TTLStockChart_C_Ctl" />
                <div id="TTLStockChart_C_EditCtl" className="TTLStockChart_C_EditCtl" />
            </div>,document.getElementById(pChartElement));
        this.mvChartElement = "TTLStockChart_C_Main";
        this.mvChartCtrlElement = "TTLStockChart_C_Ctl";
        this.mvChartEditCtrlElement = "TTLStockChart_C_EditCtl";
        // setScroll();
    }
    else
    {
        this.mvChartElement = pChartElement;
        this.mvChartCtrlElement = pChartCtrlElement;
        this.mvChartEditCtrlElement = pChartEditCtrlElement;
    }
    this.mvTimeLineHeight = 100;
    this.changeLayout("Light");
}

    TTLStockChart.prototype.drawChart = function(pData)
{
    // Point format: ["yyyy-MM-dd HH:mm:ss",close,high,low,open,volume]
    // {data:[[p1],[p2],[p3]]}

    var rawData;
    if (pData && pData.data && pData.data.length > 0)
        rawData = pData.data;
    else if (pData && pData.points && pData.points.length > 0)
        rawData = pData.points;

    if (rawData === undefined)
    {
        document.getElementById("TTLStockChart_NoData").style.display = "";
        if (this.alreadyDraw)
            document.getElementById(this.mvChartElement).style.display = "none";
        return;
    }
    document.getElementById("TTLStockChart_NoData").style.display = "none";

    if (!this.alreadyDraw) // First time draw chart with data
    {
        if (this.mvChartHeight === undefined)
        {
            console.error("TTLStockChart: Chart height not set!");
            return;
        }

        this.alreadyDraw = true;

        if (!this.mvChartWidth)
        {

            var FitWidthChart = TTLChart.fitWidth(TTLChart);
//PLEASE NOTICE THIS IS THE COMPONENT THAT BEING UNMOUNTED WHENEVER RESIZE WINDOW BROWSER

            // change the type from hybrid to svg to compare the performance between svg and canvas
            this.chartRdrObj = render(<FitWidthChart height={this.mvChartHeight} timeLineHeight={this.mvTimeLineHeight} simpleMode={this.mvSimpleMode} rawData={rawData} chartLayout={this.chartLayout} isMobile={this.isMobile} />,document.getElementById(this.mvChartElement));
            this.chartObj = this.chartRdrObj;//.getWrappedInstance();
            console.log("isMobile",this.isMobile)
        }
        else
        {
            this.chartRdrObj = render(<TTLChart width={this.mvChartWidth} ratio={1} height={this.mvChartHeight} timeLineHeight={this.mvTimeLineHeight} simpleMode={this.mvSimpleMode} rawData={rawData} chartLayout={this.chartLayout} isMobile={this.isMobile} />,document.getElementById(this.mvChartElement));
            this.chartObj = {node: this.chartRdrObj};
            console.log("this.isMobile",this.isMobile)
        }

        this.chartCtrl = render(<TTLChartControl chartMethod={this}/>,document.getElementById(this.mvChartCtrlElement));
        this.refreshChartCtrl = this.chartCtrl.refresh;

        this.chartEditCtrl = render(<TTLChartEditControl chartMethod={this}/>,document.getElementById(this.mvChartEditCtrlElement));

        if (this.setChartType_state)
        {
            this.setChartType(this.setChartType_state);
            this.setChartType_state = undefined;
        }
        if (this.importState_state)
        {
            this.importState(this.importState_state);
            this.importState_state = undefined;
        }
    }
    else
    {
        document.getElementById(this.mvChartElement).style.display = "";
        this.getChartObj().setRawData(rawData);
    }
}
... many setter here
此后,为了通过Webview嵌入到移动应用程序中,我创建了一个html:
<!DOCTYPE html>
<html style="margin: 0px;">
  <head>
    <meta charset="utf-8" name="viewport" content="initial-scale=1.0,maximum-scale=1.0,user-scalable=no"/>

    <title>TTLStockChart_Historical</title>
    <style>
    .TTLStockChart {
        /* position: absolute; */
        /* left: -5px; */
        /* right: 17px; */
    }
    </style>
  </head>
  <body style="margin: 0px;"><!-- window.location='command://onload' -->
    <div class="bootstrap-iso">
        <div id="chart">
        </div>
    </div>
  </body>
  <script src="./TTLStockChart/TTLStockChart_bundle.js"></script>
  <script>window.chartMethod = new TTLStockChart("chart");
    function updateSimpleChart(d,h)
    {
      chartMethod.setChartHeight(h);
      chartMethod.setTimeLineHeight(-1);
      chartMethod.setSimpleMode(false);
      chartMethod.showChartControl(false);
      chartMethod.showChartEditControl(false);
      chartMethod.changeLayout("Light",true);
      chartMethod.importState([
        'Line',[['InChartVol']],[['STC',[14,5,3],70],['MACD',[12,26,9],70]]
      ])
      chartMethod.drawChart(d);
      return true;
      }
    function updateChart(d,h,lh) {
      chartMethod.setChartHeight(h);
      chartMethod.setTimeLineHeight(lh);
      chartMethod.showChartEditControl(false);
      chartMethod.drawChart(d);
      chartMethod.setChartType("IntraDay");
      chartMethod.importState(["Candle",[["InChartVol"]],[]]);
      return true;
    }
上面的设置器是要为组件更新的状态。我尝试控制台登录componentWillUnmount并查看在调整浏览器大小时是否会卸载
如果此代码错误,请提出建议并纠正我:(预先感谢。Bwt我正在使用react-stockcharts库
解决方法
暂无找到可以解决该程序问题的有效方法,小编努力寻找整理中!
如果你已经找到好的解决方法,欢迎将解决方案带上本链接一起发送给小编。
小编邮箱:dio#foxmail.com (将#修改为@)
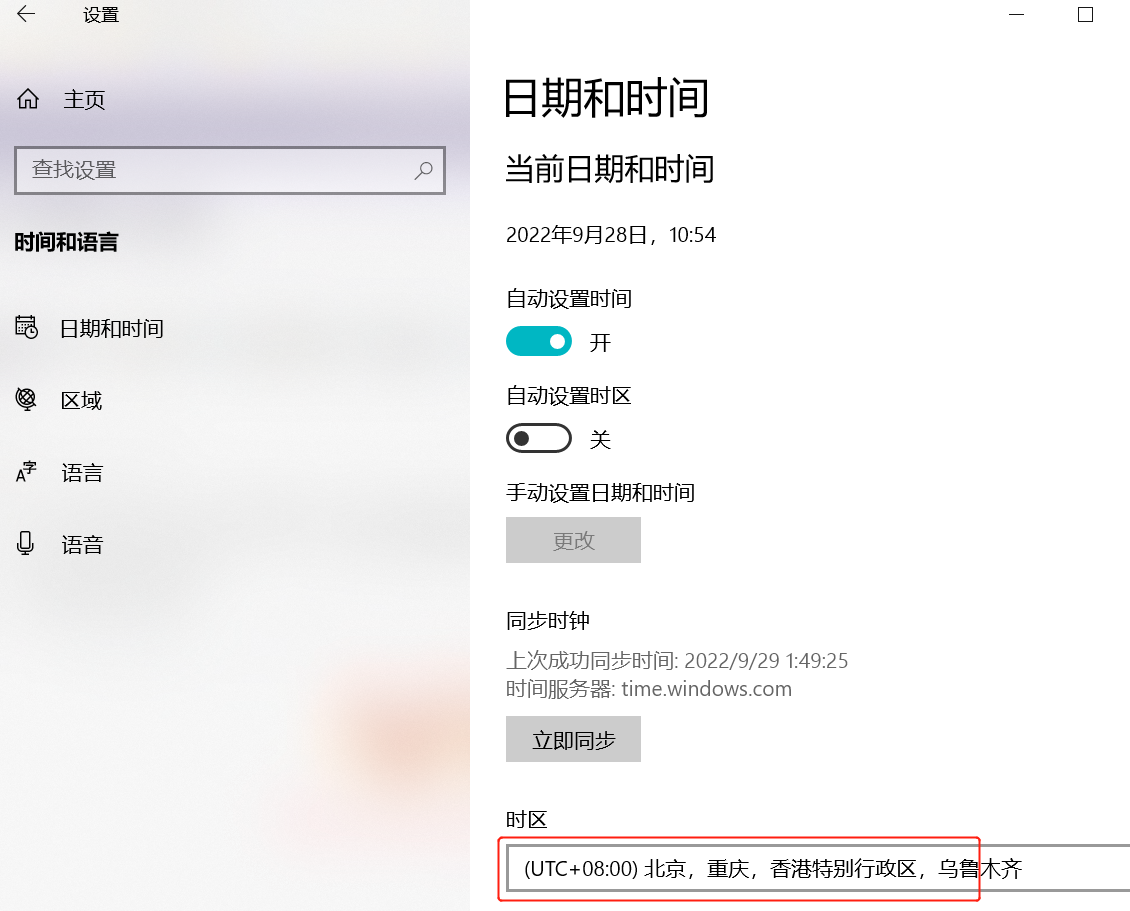 设置时间 控制面板
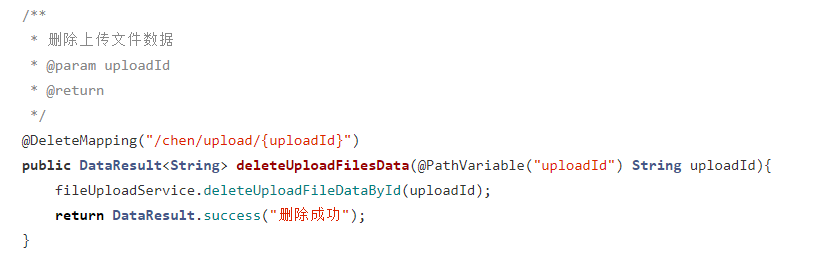 错误1:Request method ‘DELETE‘ not supported 错误还原:...