问题描述
上一个问题的答案:extrapolate in R for a time-series data由于R版本而不适用于我。
我有一个看起来像这样的数据框NEI_othertier1_long:
state    pollutant    Sector       Fuel      description    year     value
AK       Ammonia      Refining     Diesel     industrial    2008      1.18
AK       Ammonia      Refining     Diesel     industrial    2009      NA
AK       Ammonia      Refining     Diesel     industrial    2010      NA
AK       Ammonia      Refining     Diesel     industrial    2011      5.76
AK       Ammonia      Refining     Diesel     industrial    2012      NA
AK       Ammonia      Refining     Diesel     industrial    2013      NA
AK       Ammonia      Refining     Diesel     industrial    2014      5.83
AK       Ammonia      Refining     Diesel     industrial    2015      NA
AK       Ammonia      Refining     Diesel     industrial    2016      NA
AK       Ammonia      Refining     Diesel     industrial    2017      8.96
AK       Ammonia      Refining     Diesel     industrial    2018      NA
AK       Ammonia      Refining     Diesel     industrial    2019      NA
我具有2008、2011、2014和2017的值。我能够使用以下代码成功线性内插2009-2016:
    NEI_othertier1_long %>%
  dplyr::mutate( value = na.approx(value,na.rm = FALSE,rule = 2) ) -> NEI_othertier1_interpolated
但是插值法将2017年的值向前推至2018年和2019年。我想线性推算前几年的2018年和2019年的值。
我具有R版本3.5.2(并且无法更新),因此无法安装latticeExtra赖以使用Hmisc函数的approxExtrap。
感谢您的帮助!
dput(head(NEI_othertier1_long))结构(列表(状态= c(“ AK”,“ AK”,“ AK”,“ AK”,“ AK”,“ AK”,“ AK”,“ AK”, “ AK”,“ AK”,“ AK”,“ AK”), 污染物= c(“氨”,“氨”,“氨”,“氨”, “氨”,“氨”,“氨”,“氨”,“氨”, “氨”,“氨”,“氨”),CEDS_Sector = c(“ 1A1b_Pet-refining”, “ 1A1b_Pet-精炼”,“ 1A1b_Pet-精炼”,“ 1A1b_Pet-精炼”, “ 1A1b_Pet-精炼”,“ 1A1b_Pet-精炼”, “ 1A1b_Pet-精炼”,“ 1A1b_Pet-精炼”,“ 1A1b_Pet-精炼”, “ 1A1b_Pet-精炼”,“ 1A1b_Pet-精炼”,“ 1A1b_Pet-精炼”),CEDS_Fuel = c(“柴油机油”, “柴油机油”,“柴油机油”,“柴油机油”,“柴油机油”,“柴油机油”, “柴油机油”,“柴油机油”,“柴油机油”,“柴油机油”,“柴油机油”,“柴油机油” ),tier1_description = c(“燃料组合工业”,“燃料组合工业, “燃料组合工业”,“燃料组合工业”,“燃料组合工业”, “燃料组合工业”,“燃料组合工业”, “燃料组合工业”,“燃料组合工业”,“燃料组合工业”, “燃料梳。工业”, “ FUEL COMB。INDUSTRIAL”),单位= c(“ TON”,“ TON”,“ TON”,“ TON”, “ TON”,“ TON”,“ TON”,“ TON”,“ TON”, “ TON”,“ TON”,“ TON”),年份= 2008:2019,排放量= c(1.18,NA,NA, 5.76,NA,NA,5.83,NA,NA,8.96,NA,NA)),row.names = c(NA,-12L),class = c(“ grouped_df”,“ tbl_df”,“ tbl”,“数据.frame”),组=结构(列表(状态=“ AK”, 污染物=“氨气”,CEDS_Sector =“ 1A1b_宠物精制”, CEDS_Fuel =“柴油机油”,tier1_description =“燃油组合工业”, 单位=“ TON”,.rows = list(1:12)),row.names = c(NA,-1L),class = c(“ tbl_df”,“ tbl”,“ data.frame”),.drop = TRUE))
解决方法
approxExtrap只是approx的包装,因此您可以复制函数定义并使用它。
NEI_othertier1_long %>% dplyr::mutate(x = approxExtrap(year,value,year,na.rm = TRUE)$y)
如果找不到,则为approxExtrap:
approxExtrap <- function (x,y,xout,method = "linear",n = 50,rule = 2,f = 0,ties = "ordered",na.rm = FALSE)
{
  if (is.list(x)) {
    y <- x[[2]]
    x <- x[[1]]
  }
  if (na.rm) {
    d <- !is.na(x + y)
    x <- x[d]
    y <- y[d]
  }
  d <- !duplicated(x)
  x <- x[d]
  y <- y[d]
  d <- order(x)
  x <- x[d]
  y <- y[d]
  w <- approx(x,xout = xout,method = method,n = n,f = f,ties = ties)$y
  r <- range(x)
  d <- xout < r[1]
  if (any(is.na(d)))
    stop("NAs not allowed in xout")
  if (any(d))
    w[d] <- (y[2] - y[1])/(x[2] - x[1]) * (xout[d] - x[1]) +
    y[1]
  d <- xout > r[2]
  n <- length(y)
  if (any(d))
    w[d] <- (y[n] - y[n - 1])/(x[n] - x[n - 1]) * (xout[d] -
        x[n - 1]) + y[n - 1]
  list(x = xout,y = w)
}
 设置时间 控制面板
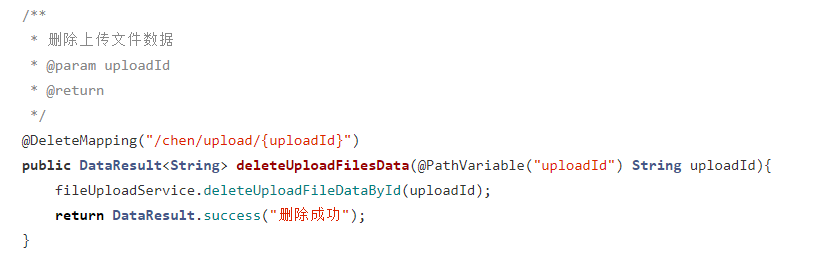 错误1:Request method ‘DELETE‘ not supported 错误还原:...