问题描述
我正在努力创建一个填充图像和滤镜/蒙版的程序。我遇到麻烦的地方实际上是试图在图像的每一位上移动此滤镜,而没有使用函数来这样做。
这是我到目前为止所拥有的。
std::vector解决方法
不使用conv2()函数通过卷积过滤图像(移动过滤器)

填充图像:
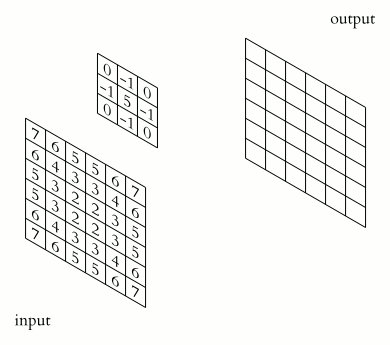
填充图像可以通过沿图像的侧面连接零来实现。每种尺寸所需的填充量取决于过滤器/内核的尺寸。下图总结了所需的填充量。请注意,最佳做法是确保过滤器的尺寸(高度和宽度)为奇数。如果滤波器没有奇异的尺寸,最好用零填充滤波器,我将把它留给读者做为进一步的任务。有关填充的更多详细信息,请参见以下问题的答案:Rotating image with trigonometric functions and image padding。一个很棒的动画GIF(不是我创建的),可以很好地形象化卷积过程:Animated image convolution process。

Image = imread("Pikachu.png");
Test_Filter = [-1 0 1; -2 0 2; -1 0 1];

%Grabbing the dimensions of the filter and image%
[Filter_Height,Filter_Width] = size(Test_Filter);
[Image_Height,Image_Width] = size(Image);

%Evaluating the padding thickness required%
Side_Padding_Size = floor(Filter_Width/2);
Top_And_Bottom_Padding_Size = floor(Filter_Height/2);

%Creating the blocks of zeros to concantenate to the image%
Side_Padding = zeros(Image_Height,Side_Padding_Size);
Top_And_Bottom_Padding = zeros(Top_And_Bottom_Padding_Size,Image_Width+2*Side_Padding_Size);

%Padding the sides of the image by concatenating%
Padded_Image = [Side_Padding Image Side_Padding];
Padded_Image = [Top_And_Bottom_Padding; Padded_Image ;Top_And_Bottom_Padding];

subplot(1,2,1); imshow(Image);
subplot(1,2); imshow(Padded_Image);
将过滤器应用于图像:
要将滤镜应用于图像,必须设置遍历的界限/范围。由变量Row和Column递增的外部for循环指示左上角像素,以在给定时间开始扫描与滤波器重叠的区域。下图显示了由滤镜大小设置的界限。下图中的红色方块表示for循环(过滤器的左上像素)可以通过的最大范围。您可能还希望通过旋转滤镜内核并应用相同的方法来添加垂直和水平滤镜。在进行水平和垂直滤波之后,您可能希望获得结果的大小。以下示例仅在一个方向上进行过滤。描述卷积和伪实现的完整PDF:GitHub PDF: Image Convolution

%Calculating bounds of traversing through the image%
[Padded_Image_Height,Padded_Image_Width] = size(Padded_Image);
Row_Limit = Padded_Image_Height - Filter_Height + 1;
Column_Limit = Padded_Image_Width - Filter_Width + 1;


Filtered_Image = zeros(Image_Height,Image_Width);

for Row = 1: Row_Limit
   for Column = 1: Column_Limit


%Grabbing pixels overlapping filter%
Overlap = Padded_Image(Row:Row+(Filter_Height-1),Column:Column+(Filter_Width-1));
Filtered_Portion = double(Test_Filter).*double(Overlap);
Filtered_Portion = sum(Filtered_Portion,'all');
Filtered_Image(Row,Column) = Filtered_Portion;


   end
end


subplot(1,1); imshow(Image);
title("Original Image");

subplot(1,2); imshow(uint8(Filtered_Image));
title("Filtered with Sobel Edge Filter");
使用MATLAB R2019b运行