问题描述
我正在尝试记录一些基本的 gql 方法详细信息 - 解析器/操作名称和持续时间。 I've started looking at using .AddHttpRequestInterceptor((context,executor,builder,ct)
并从构建器获取信息,但即使我可以在调试器中看到它,方法名称也隐藏在私有成员中,例如:
((HotChocolate.Execution.QueryRequestBuilder)builder)._query.Document.Definitions[0].SelectionSet.Selections[0].Name.Value
我确信有一种更简单、更好的方法可以连接到管道中以获取方法名称并将其与调用持续时间一起记录。
我发现了一篇关于使用 DefaultGraphQLExecuter 的 GraphQL.Net 的文章 -
public class GraphQLExecutorWithDiagnostics<TSchema> : DefaultGraphQLExecuter<TSchema>
它提供了一个 operationName 参数
Task<ExecutionResult> ExecuteAsync(
,看起来很理想。
我将登录到 AppInsights,但这暂时不相关,我只想先获取信息。 我使用的是 v11.0.8
解决方法
您正在寻找的是 DiagnosticEventListener
您可以扩展这个基类并覆盖您记录所需的方法。
public class CustomDiagnosticListener : DiagnosticEventListener
{
    public override IActivityScope ExecuteRequest(IRequestContext context)
    {
        return EmptyScope;
    }

    public virtual IActivityScope ResolveFieldValue(IMiddlewareContext context)
    {
        return EmptyScope;
    }
}
要使用此诊断侦听器,您必须将其添加到架构中
services.AddGraphQLServer()
    ...
   .AddDiagnosticEventListener<CustomDiagnosticListener>()
如果您有依赖项,您的侦听器必须重新加载它们,则必须手动重新加载它们:
services.AddGraphQLServer()
    ...
   .AddDiagnosticEventListener<CustomDiagnosticListener>(
         sp => new CustomDiagnosticListener(
                sp.GetApplicationService<MyDependency>()))
 设置时间 控制面板
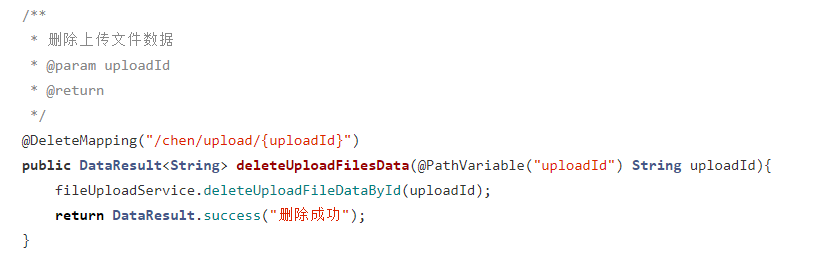 错误1:Request method ‘DELETE‘ not supported 错误还原:...